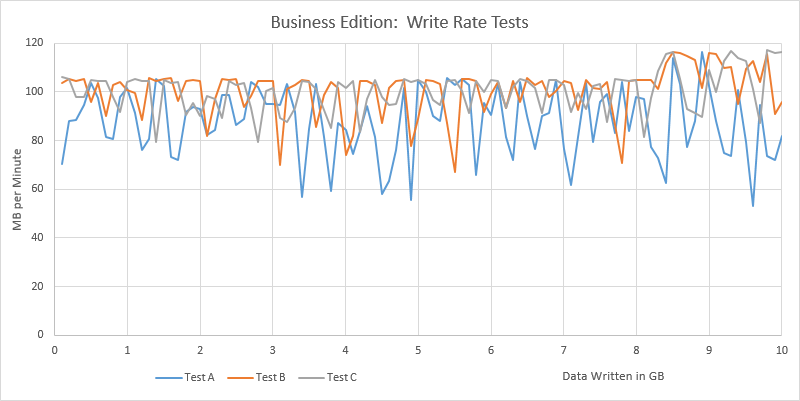
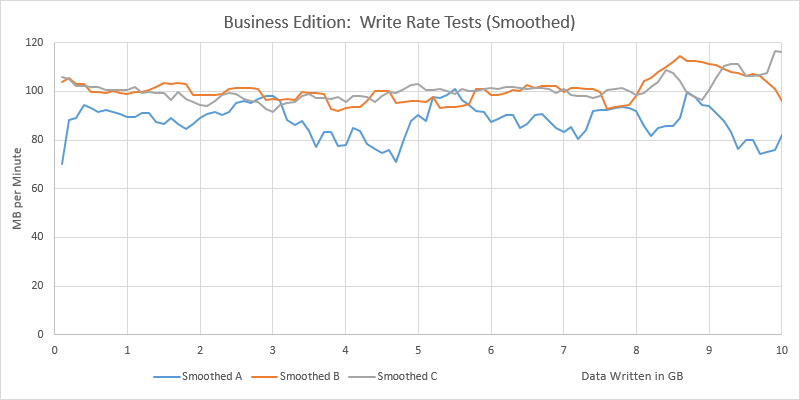
Introduction
Version 12 of Azure SQL Database has now reached General Availability in Europe. See the announcement here. So, now it is time to re-run those earlier performance tests, to see where performance has settled at.
This post includes:
- updated read / write metrics
- a new CPU benchmark and
- updated memory allocation metrics.
Microsoft publish very few absolute performance metrics regarding Azure SQL Database. The tests described here involve indirectly calculating absolute metrics. Methodologies are described below.
All tests were conducted at least three times to check for consistency and to reduce the risk of any random variations affecting the results. (That is a lot of tests, data collection and processing – nearly 80 test runs in total).
For reference, these tests were conducted in the Western Europe data centre, against the following Azure SQL Database version (select @@version):
- Microsoft SQL Azure (RTM) – 12.0.2000.8 Jan 29 2015 07:51:58
Unit of Measure
Note that the unit of measure for throughput rates in this post (and the other posts in this series) are MB per minute. This is primarily because, at the lower tiers (and even the higher tiers until recently), rates of MB per second would be 0.xx, 1.xx, etc. As the throughput rates have been increased, particularly recently, this has led to the higher performance level rates entering the thousands, so we have the opposite problem (i.e. too large numbers at the top end). Still, despite that, I have opted to retain the same unit of measure throughout, to keep comparisons easier. In the future, I may move to MB per second, if I get a lot of feedback in that direction.
Read Rate Tests
The test is based around reading data from a series of identical tables. The tables contain a mixture of basic data types – no large object data types, all in-row data. Average row size is around 410 bytes.
The test involved using a set of test data that is likely much larger than the SQL Buffer Pool sizes:
- Basic: 1.9 GB
- Standard S0: 10 GB
- Standard S1: 20 GB
- Standard S2: 30 GB
- Standard S3: 36 GB
- Premium P1 and P2: 36 GB
A new database was created in each service level and populated to the sizes given above. The database was then copied (using the Database Copy facility). My understanding is that this performs a physical copy of the database files (determined from some other tests I have undertaken previously) and results in a new database which has an empty buffer pool i.e. no data cached in memory. The test then involves sequentially reading through the database reading data from disk allowing the maximum physical disk read rate to be measured.
Data was divided into 1 GB tables (100 MB tables for Basic Tier) and each table was read sequentially.
The SQL statements used to read through the database were similar to the following:
select count(*) from Table0
where [Bit1] is not null and
[TinyInt1] between 10 and 240 and
[Int3] between 100000 and 2000000000 and
[Money2] between 0 and 10000000
No indexes (other than a clustered index on the RowId primary key) were present on the tables. A count(*) was used to ensure performance is not held back either by complex processing or by waiting for slow network I/O returning results to the client.
Results
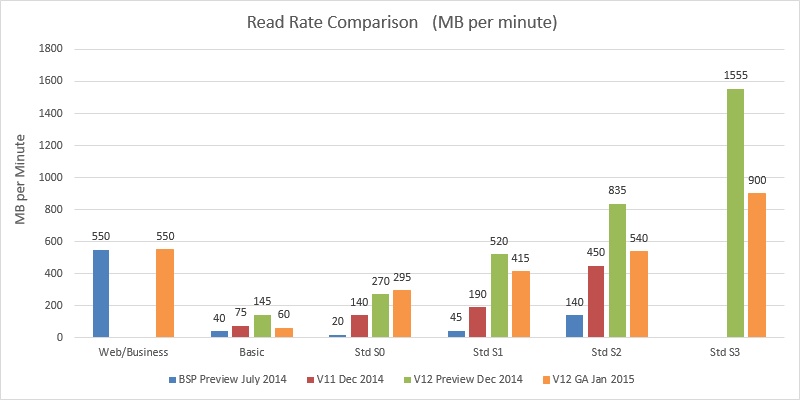
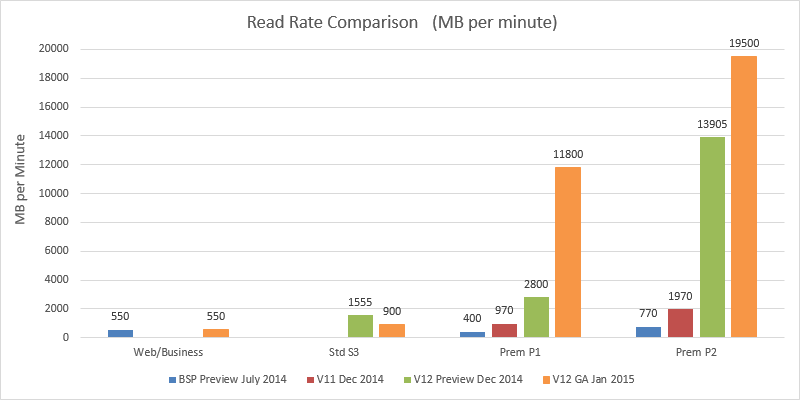
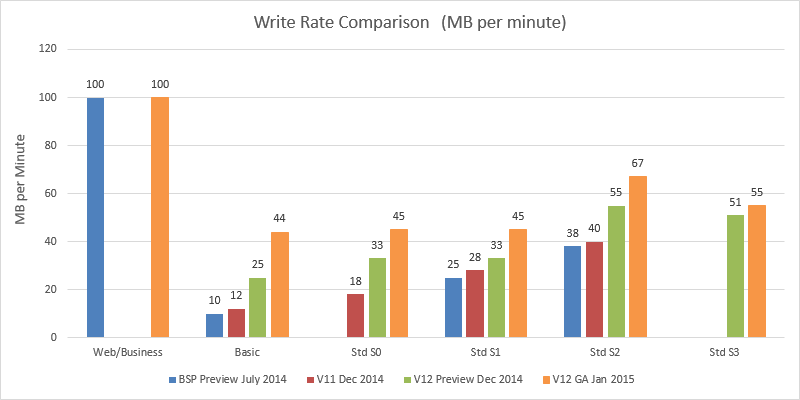
The blue bars show performance values obtained in my first tests in July 2014 during the preview of the newer service tiers (Basic, Standard and Premium). The red bars show performance in the current generally available version (i.e. V11) of SQL Database. V12 preview performance, measured in December 2014, is shown in the green bars. The orange bars show V12 GA performance (except for Web/Business, which only exists at v11 – the orange Web/Business bar shows the result of a v11 test conducted in January 2015).
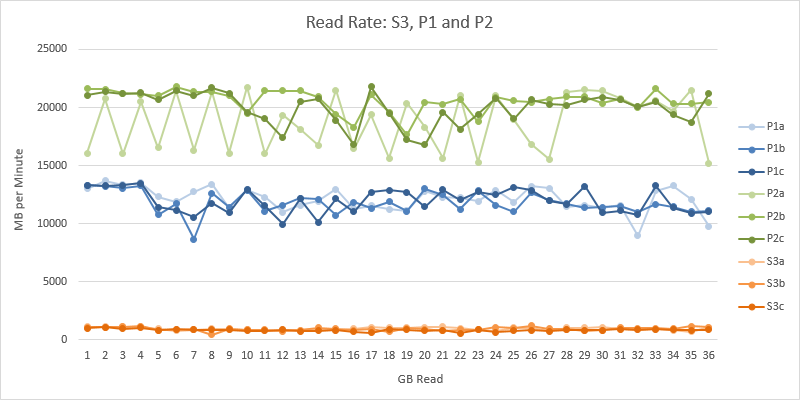
Premium P1 and P2 were also tested:
Several interesting observations here. Most notably, Premium P1 and P2 have received very significant read performance increases. Premium performance now makes Web/Business performance appear tiny in comparison. With this performance we can perhaps now understand why Microsoft set the Premium Tier prices so expensively in comparison to Web/Business. No doubt, last summer when the Premium Tier pricing was announced, it was with this performance level in mind. I expect Microsoft faced an interesting dilemma last year, do they pitch the initial Premium tier price lower in July 2014 (in line with the initial lower performance) and then dramatically increase it in January 2015 as this v12 upgrade comes on-line (and annoy customers in Jan 2015), or do they set it higher from the start (at the risk of making Premium look very poor value initially). Obviously they chose the latter, and now the full story is becoming clearer.
This is a good point to note that at the beginning of these tests, the SQL Server Buffer Pool was empty (verified by checking the memory usage column in the sys.dm_db_resource_states DMV). In addition, five to six hours had also elapsed between the creation of the database copies and the running of the tests, which should reduce potential effects from storage layer caching (though there is no way to verify this). Thus the tests should be measuring the read rate from disk, not cache.
Standard Tier v12 GA performance for S1, S2 and S3 is significantly less than in preview. However, it would not be fair to criticise Microsoft for any performance changes here. It was quite clearly stated during the preview that performance could/would be adjusted as the service heads towards general availability.
More important is the comparison between current v11 performance and v12 GA performance. Here we can see that maximum read rates under S0 and S1 have more than doubled. S0 and S2 have received a slight increase. Curiously Basic tier seems to have received a slight decrease.
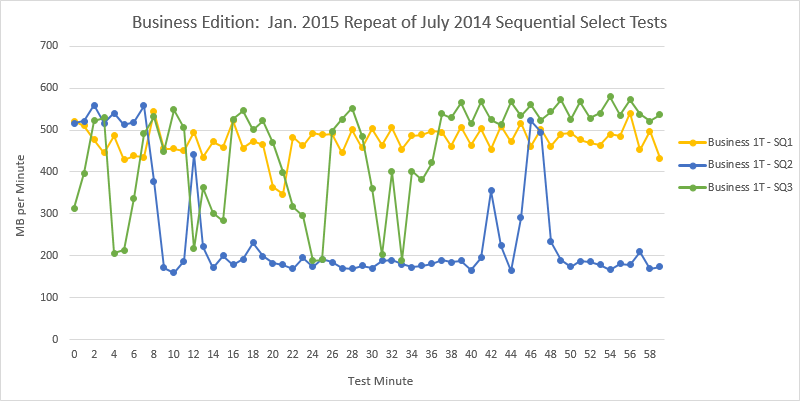
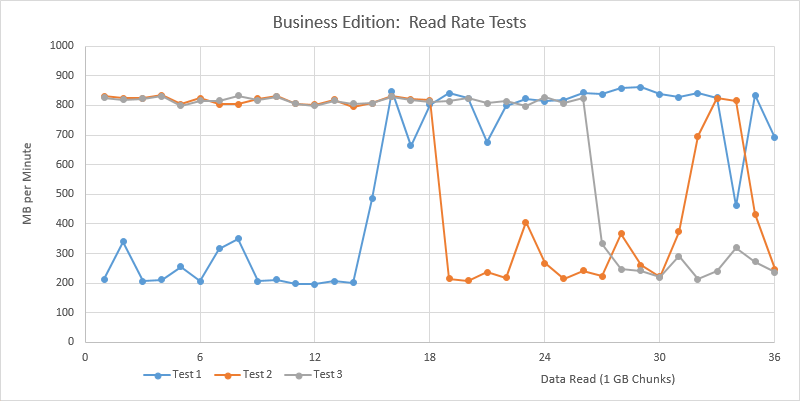
It is particularly interesting to see where S2 and S3 read performance now sits. S2 runs at almost the exact average of Web/Business. Current Web/Business read performance is on average around 550 MB per minute though is quite volatile flipping between 200 MB per minute and 800 MB per minute (see my previous post here for more details).
S3 runs at on average 900 MB per minute – i.e. well above the average Web/Business performance and above even the Web/Business peak rates.
There is a wide gap between S3 performance and P1 performance. Both S3 and P1 are rated at 100 DTUs, though P1 costs five times as much as S3. Clearly, for that price difference you get a massive amount of extra read-performance. This suggests that the DTU figures do not take into account I/O performance limits/variations between tiers / performance levels.
Read Rate Consistency
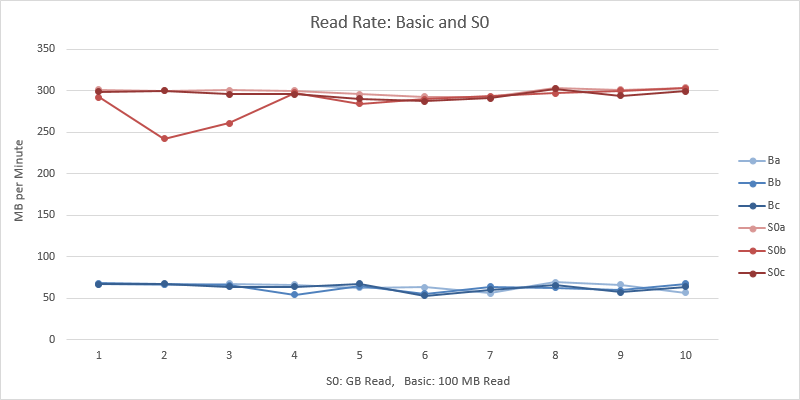
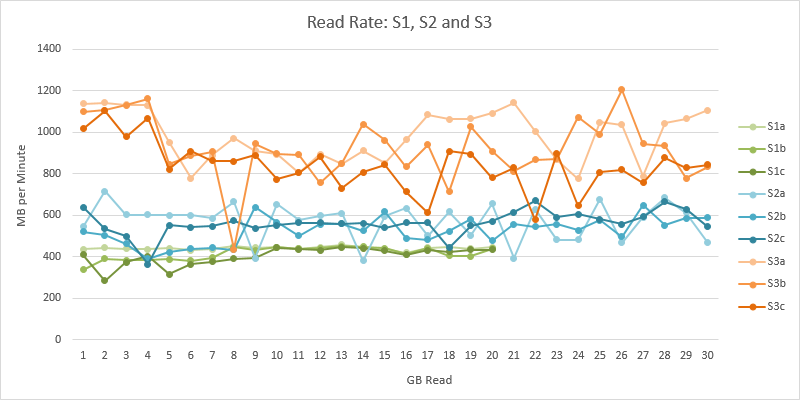
The following charts show how the read rates varied over the duration of the tests. Each read test was performance three times at each performance level – labelled as (a), (b) and (c) in the charts:
A point is plotted on the chart for each table read during the test. For Basic tier, each table contained 100 MB (showing first 1GB only on the chart). For the other service tiers, each table contained 1 GB.
The chart shows that read rates were generally very consistent throughout. Continuing with the other service tiers:
S1 read performance was generally consistent, S2 read performance varied a little but there does seem to be some quite wide variation of S3 read performance. For P1 and P2:
Again, both P1 and P2 are reasonably consistent in their performance. The P2a test run was a little more variable than the other two P2 tests. S3 is shown on this chart to illustrate just how much higher Premium performance is than S3. On this chart, the scale is such that the relatively wider variation in S3 performance (shown on the previous chart) is barely even visible here.
Read Test Resource Usage
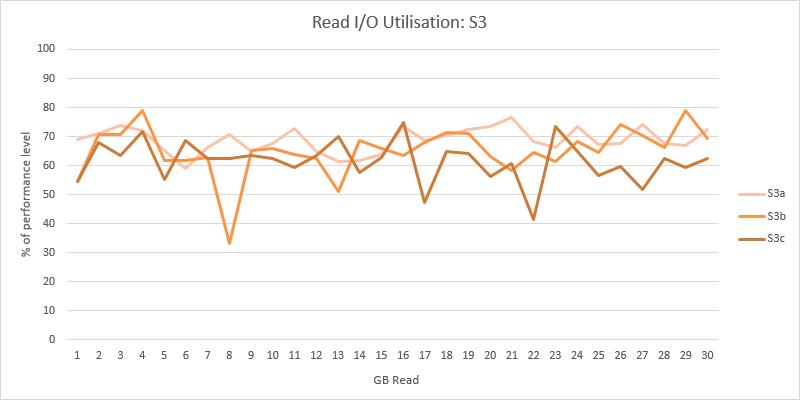
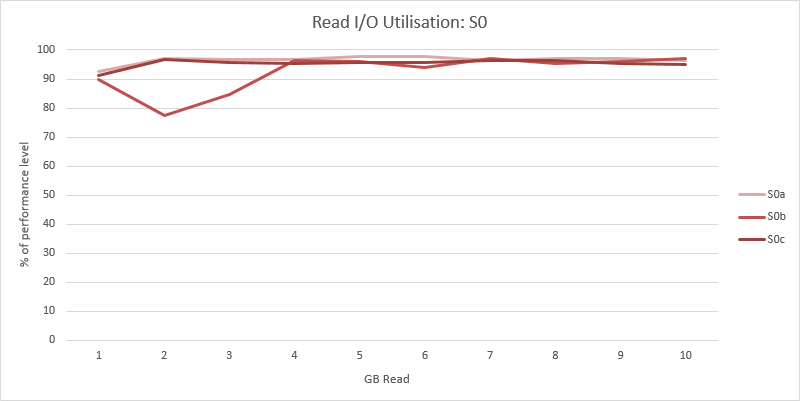
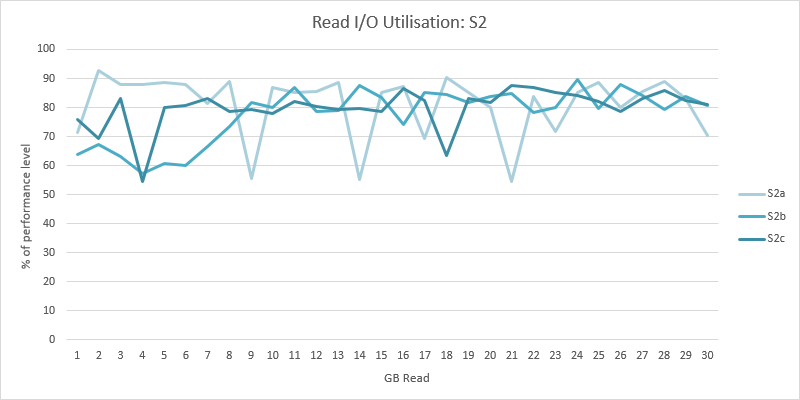
During the read tests, the data from the sys.dm_db_resource_stats DMV was captured. This showed that, in the S0, S1 and S2 tests, around 90% of the available read IO resources were being consumed, so these results should be a good reflection of the maximum rates available.
The S3 result was a little more volatile, showing that at times significantly less than 100% of the available read resources were being consumed.
As you may expect, the drops in read utilisation are generally speaking at the same points in the test as the drops in read rate occur (e.g. for at 8 GB in S3b and 22 GB in S3c). This suggests the I/O subsystem was unable to supply the maximum amount of data per second that SQL Server could consume in this performance level. All in all this suggests that Microsoft still need to apply some performance optimisations for S3.
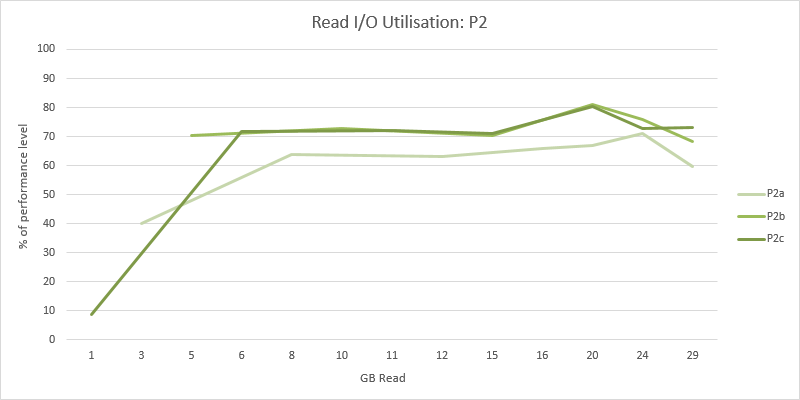
Interestingly, the chart for P2 also shows that it was not consuming all of the theoretically available read resources:
This chart has less detail than previous charts. This is because P2 read the test database very quickly, and there is only one row in the sys.dm_db_resource_stats DMV for every fifteen seconds. Even still, the general trend is still clear enough. The test query was consuming only around 70% of the available read resources during the test.
Knowing that the P2 test read on average at 19,500 MB per minute at 70% read utilisation, we can estimate that the theoretical P2 maximum read rate would be around 28 GB per minute. Similarly, we can estimate that the maximum theoretical read rate for P1 (which was reading 11,800 MB per minute on average at 80% read utilisation) would be around 15 GB per minute.
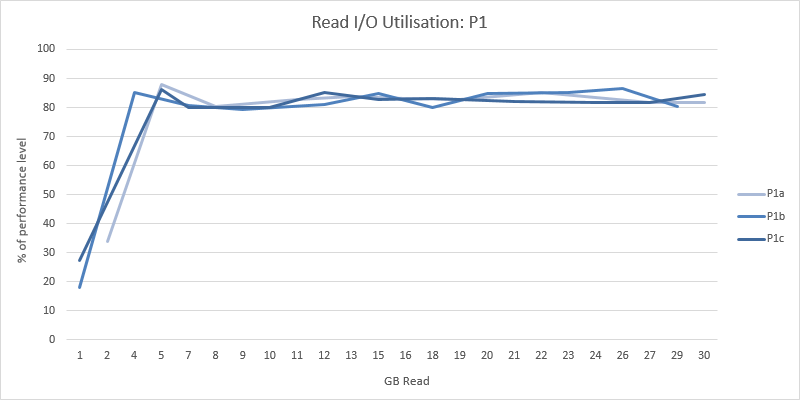
More Read Utilisation charts for the other performance levels can be found in an appendix at the end of this article.
Write Rate Tests
This test aimed to cache a relatively small amount of data in the buffer pool (100 MB), then repeatedly write this until a specified total data volume had been written. Each 100 MB chunk was written using a single Insert statement. The total data volume was specified to aim for a test very roughly around 30 minutes to 1 hour in length The time taken would then allow an estimate of the maximum write rate. Total data volumes used were:
- Basic and S0 – 1 GB.
- S1, S2 and S3 – 2 GB.
- P1 – 5 GB.
- P2 – 10 GB.
Results
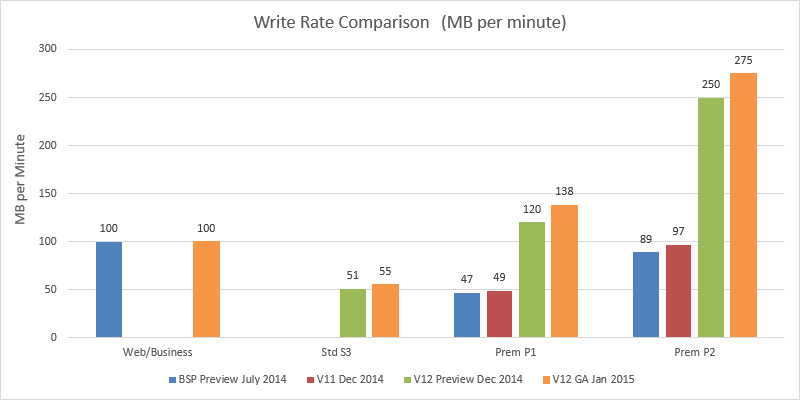
Both Basic Tier and all four performance levels within Standard Tier have received notable write rate increases.
However the first question here is this: why is S3 write performance notably less than S2 write performance? Tests at both S2 and S3 were repeated three times each – the results were consistent in all cases. This seems very strange and I have put this question to Microsoft.
Edit: I have received a response from Microsoft that the current write rates for the Standard Tiers are in v12 are about to be adjusted. Once this has been completed I will update the details here.
It is interesting to note however, that none of the performance levels in Standard Tier come close to matching the Web/Business write performance. Having said that, if S3 write performance was actually above S2 (as surely it is supposed to be) than S3 may actually come close to Web/Business. I can see this being a key question for many existing Web/Business customers.
Moving on to write performance of the Premium Tier:
P1 and P2 see significant write performance increases – a factor of almost three over current v11. P1 write performance is now clearly higher than Web/Business – which is not the case in v11. v12 P1 writes also outperform v11 P2.
Write Rate Consistency
The following charts show how the write rates varied over the duration of the tests. Each write test was performance three times at each performance level – labelled as (a), (b) and (c) in the following charts.
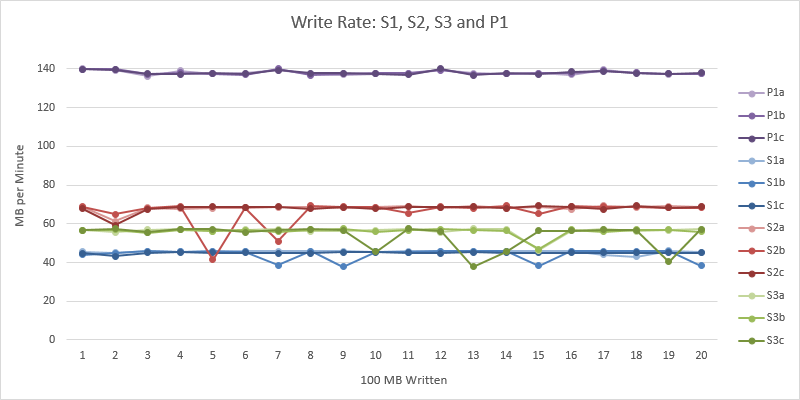
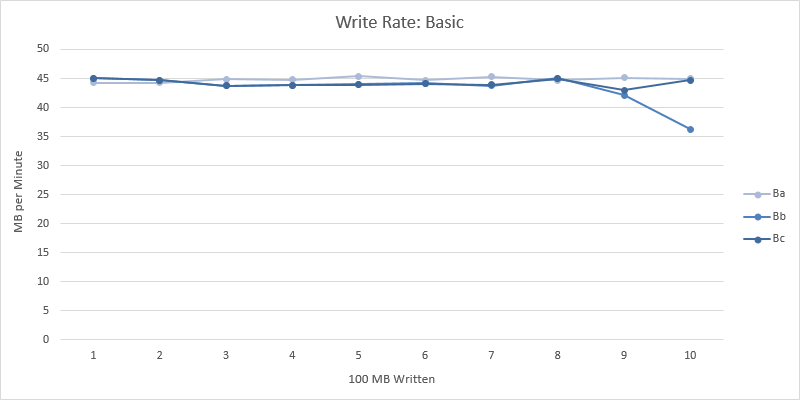
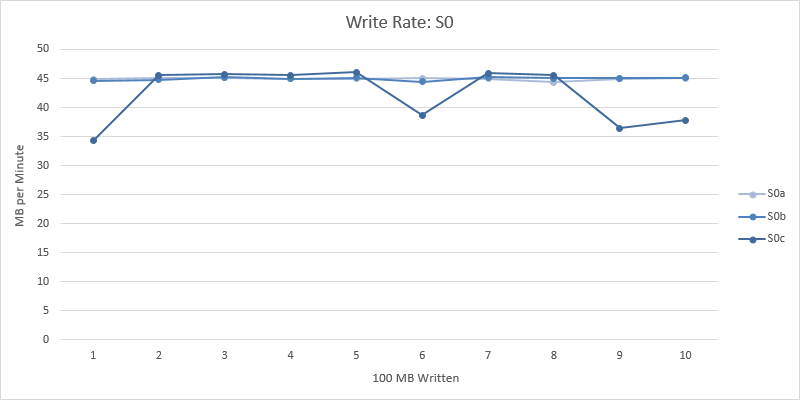
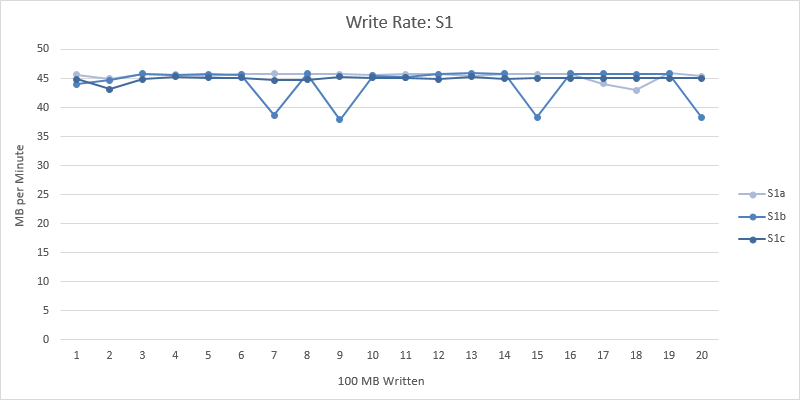
This data shows Basic, S0 and S1 writing very consistently at around 45 MB per minute throughout. These charts are included in an appendix at the end of this post (since they all write at around 45 MB per minute, each performance level must be plotted on separate charts to avoid all the lines overlapping – which results in just too many charts to include in the main body of the text).
Comparing S1, S2, S3 and P1:
This chart shows how the write rates for S1, S2, S3 and P1 are very consistent in all tests.
This chart also shows how very consistently S2 outperforms S3. Surely there is a bug here in Azure?
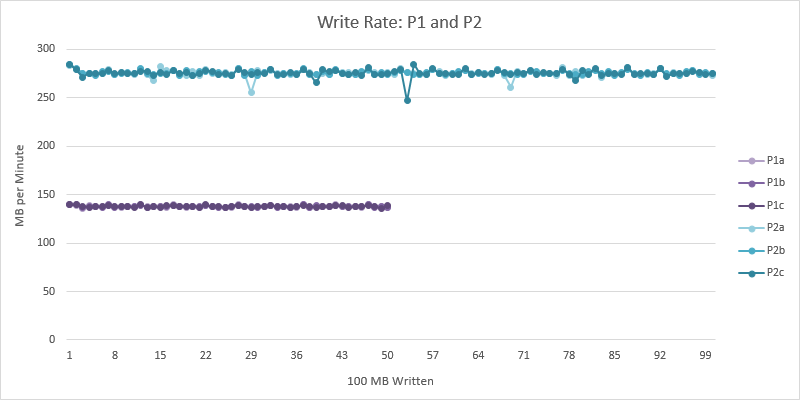
Now comparing P1 and P2:
Again, the write rate is extremely consistent for P2.
Write Test Resource Usage
During the write tests, the data from the sys.dm_db_resource_stats DMV was captured. Unsurprisingly given the consistency shown above, this data shows the write-utilisation at very close to 100% (i.e. 98%, 99%), throughout. As such, there is very little point plotting the data.
CPU Tests
In previous series of tests I have not compared CPU performance between the different performance levels. As part of this series of tests, I decided running some tests to compare CPU performance between the different performance levels might be interesting.
The test is based around running the same CPU-heavy workload in each of the different performance levels and comparing the results. The chosen workload is a forced loop join where the join condition is something non-trivial, for these tests:
(abs(((t1.Int1 * t2.Int2) + t1.Int3) - ((t2.Int1 * t1.Int2) + t2.Int4)) < 17) and (abs((power(t1.Int5 % 5, 3) - (t2.Int5 % 25))) < 7)
This query means that a relatively small number of rows will require a significant amount of time to process. Using a relatively small number of rows is important because it eliminates any potential delays due to time waiting for the data to be read. The test table was created with 280,000 rows of data which is in total around 10 MB. This entire table was read before the test began properly to get the data loaded into the buffer pool. All in all this means close to all of the query execution time is CPU time.
The query was written so that SQL Server should use a parallelised execution plan. This allows the workload to expand to exploit the full amount of CPU resources available within the performance level. The exact same data was used for every test.
The test script used automatically ran the test multiple times, recording the results for each test. The number of rows selected from the test table was increased with each test (SELECT TOP … ORDER BY RowId was used to ensure data is picked up in the same way in each performance level). The number of rows was increased until the SELECT ran for over two minutes, at which time no further tests were peformed (i.e. the row count wasn’t increased further).
The test was developed on my development machine. This has the added advantage that the Azure results can be compared to a machine of known specification. My development machine was built in 2010 – at the time it was a relatively high end machine. At the core of the machine is an Intel i7 930 2.8 GHz quad core processor with hyperthreading (i.e. eight logical cores) running on an ASUS P6T Deluxe motherboard. Details of the processor can be found here. Details of the motherboard here. My development machine is running an up to date copy of SQL Server 2014 so it is assumed that the engine internals involved in the test are close enough to those running in Azure SQL Database to make a comparison valid.
Results
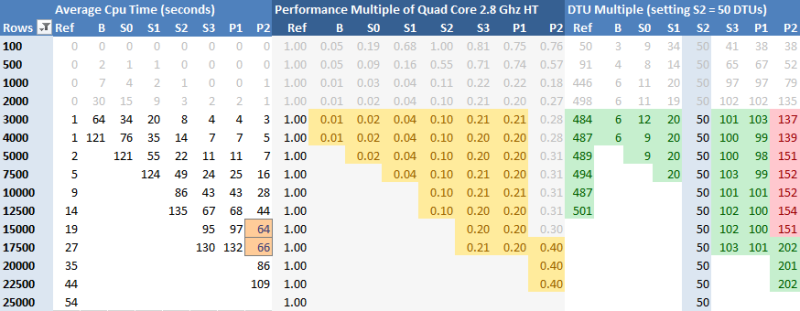
Given the relatively large number of test cases, each with different row counts, it is easier to display these results in tabular form:
The table above shows three metrics, explained below.
Average query time in seconds
This shows the time taken to execute the test query in each performance level – row count combination. For example, in the S0 column we can see that 34 seconds were required to perform the join, where the first 3000 rows were selected from the table. The Ref column refers to my development machine (i.e. the reference machine).
In case anyone is jumping to the wrong idea… as I said above, the test query used was deliberately chosen to take a relatively long time to execute. This query time is not indicative of the time taken to join 3000 rows in a typical business scenario! In fact, the actual execution time is not really meaningful since the query is junk – all we care about is that it is a relatively CPU heavy workload that we can repeatedly execute in different environments and compare the execution times.
It is by comparing results between different environments that more meaningful insights can be gained.
When interpreting this table, it is important to understand what are valid/simple comparisons and what aren’t. Comparing along the rows is valid e.g. comparing the the time to join 7500 rows on an S0 and an S1. Joining the first 7500 rows from the test table on an S2 required 49 seconds. Performing exactly the same join across the same test data on an S3 required 24 seconds. Since it was the same workload, we can say S3 is twice as powerful in CPU terms as S2.
Comparing between rows in this table is not so simple. I.e. this workload does not scale linearly. E.g. on an S2, joining 5000 rows required 22 seconds. Joining 10000 rows required 86 seconds. As we are talking about a loop join here, double the rows equals four times the workload, which the results roughly agree with.
Finally, very short query times are unlikely to be good sources of information. It is possible in much shorter queries that SQL Server may use a different execution plan. It is also possible a larger percentage of the time may be attributable to non-CPU sources. This is roughly those results from joining 2000 rows or less, which is why these rows have been grayed out in the table.
Performance Multiple of Reference System (Quad Core 2.8 GHz i7 930)
This metric is shown in the middle part of the table. If we assign my development machine a metric value of 1, then comparing the query times between this system and the different Azure performance levels, we can see what fraction of my development machine CPU resources those performance levels offer. For example, if a (CPU-heavy) query runs in ten seconds on my machine and takes twenty seconds in a particular performance level in Azure, we can say that this performance level in Azure offers half the CPU resources of my development machine.
The numbers highlighted in yellow show these results. These show that, for example, S3 offers about one-fifth of the CPU resources of my dedicated development machine.
DTU Multiple
This metric is shown in the latter part of the table. Taking S2 at 50 DTUs as a reference point and using the performance multiples above, it is possible to calculate the effective DTUs of each of the other performance levels. The numbers highlighted in green show these results.
Discussion
It is interesting just how closely these results align with the number of DTUs allocated per performance level in Azure. It is clear that the CPU resources allocated to each performance level in Azure SQL Database very closely reflect the DTU values stated by Microsoft.
By this calculation, my desktop machine offers the equivalent (in terms of CPU resources) of 500 DTUs! I was a little surprised that even a P2 database has less than half of the CPU resources of my development machine. Though, as I said, my development machine is still moderately high-spec (and probably way overpowered in CPU terms) and of course, my development machine does not offer any of the other great features in Azure SQL DB!
P2 Query Plans
In some of the test results, P2 appears to only offer around 150 DTUs. These are the cells highlighted in red above. This was actually due to Azure SQL DB using a slower query plan when executing these test cases. For all of the other tests, the sys.dm_db_resource_stats DMV showed 100% CPU utilisation when running the tests. For the test cases highlighted in red, CPU utilisation was reported at being only around 70%, hence the query took longer to execute. From the 17500 row test case onwards, the faster query plan was used. The changeover between the two plans can be seen clearly in the CPU Time results. Normally, in a given performance level, as the row count is increased there is a significant CPU time increase too. However, while 15000 rows required 64 seconds to execute, 17500 rows required 66 seconds, i.e. only two seconds more, as a result of the switch to the faster query plan. These are the two timings highlighted in orange in the table above.
Memory Tests
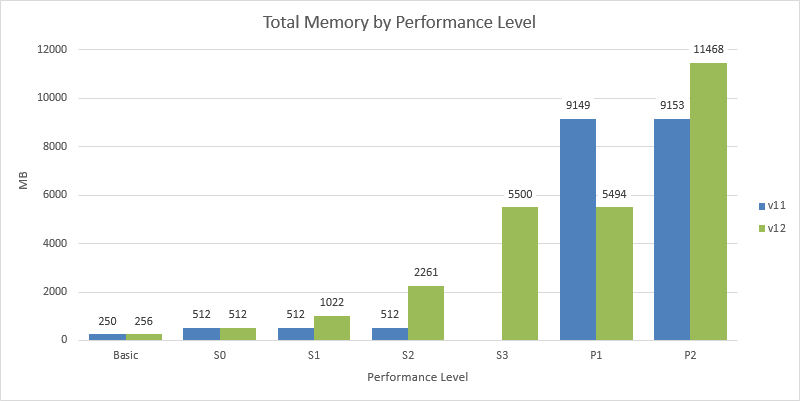
The maximum possible memory usage under each of the performance levels can be estimated using the method described in my earlier post. This method was used again to obtain estimates for V12:
Results
These results show some significant changes to the memory allocated to each performance level between v11 and v12. S1 and S2 are able to access a significantly higher amount of memory in v12.
Interestingly S3 and P1 are allocated the same amount of memory, which mirrors the fact they both have the same DTU rating of 100. This does mean a significant reduction in the amount of memory available under P1, however this change does make some sense.
Under v11, the memory allocated was solely determined by service tier (i.e. Basic, Standard or Premium). All databases within a given tier had the same memory allocated, irrespective of the performance level. Under v12, this has become more fine grained, being based on both service tier and performance level within the tier. With this in mind, the change to P1 memory allocation can be seen to be more like a correction. Under v11, P1 was over allocated relative to P2 (or, from the other point of view, P2 was under-allocated compared to P1). The same applies to S0, S1, S2 and now S3.
Conclusion
Version 12 of Azure SQL Database has brought many significant performance increases over current v11. The read rate improvements for S1 and S2 are significant. The read rate improvements for P1 and P2 are dramatic. The write rate improvements are also significant, especially again for the Premium Tier. Finally this lifts P1 performance well above that of Web/Business.
The most significant questions raised by these tests are around S3. S3 write performance is less than S2 – surely a bug/issue. There also appears to be some volatility around the S3 read rate consistency currently, hopefully this will settle down shortly.
For customers looking to migrate from Web/Business, S3 still looks promising, however the question of the S3 write rate needs answering. If this is not rectified, then moving from Web/Business to S3 will incur a roughly 50% cut in the write rate available. If affordable, Premium now offers a level of resources significantly / dramatically above that available in Web/Business.
These tests have shown how the DTUs allocated to each performance level now closely reflect the resources available in each tier. For the memory and CPU allocation there is close to a direct correlation.
Edit: 2nd Feb 2015: Additional Test Results
I have run a couple of additional tests (following the same methodology) since the rest of this post was written that have thrown up some interesting results. I’ll walk through them:
Massive P2 Read Rates
I conducted a further short series of P2 read tests that have shown dramatically different read rates. I repeated the tests in the other tiers which did not show any significant increase.
- Repeat of P2 Read Test: Average Read Rate = 39,200 MB per minute
- Repeat of P2 Read Test: Average Read Rate = 39,800 MB per minute
Clearly a massive increase on the earlier tests. The read rates were sustained throughout the tests. Several hours elapsed between the database copies being created and the tests being run (as in the earlier tests). Buffer pool was empty at the start of the tests. Perhaps the effect of data in a storage cache? - Repeat of P1 Read Test: Average Read Rate = 12,000 MB per minute
i.e. matches the earlier tests described in the main body of the post. - Repeat of S2 Read Test: Average Read Rate = 580 MB per minute
i.e. matches the earlier tests described in the main body of the post. - Repeat of S0 Read Test: Average Read Rate = 292 MB per minute
i.e. matches the earlier tests described in the main body of the post.
Effect of NOLOCK Hint
Using the NOLOCK hint (where practical) can increase the read rate, significantly so for the premium tier:
- P2 Read Test: Average Read Rate = 69,000 MB per minute
- P2 Read Test: Average Read Rate = 60,900 MB per minute
Almost double the P2 read rate result from earlier in the same day. - P1 Read Test: Average Read Rate = 13,800 MB per minute
i.e. around 2,000 MB per minute above the earlier result. - Average Read Rate = 750 MB per minute
i.e. around a 170 MB per minute increase over the earlier result. - Repeat of S0 Read Test: Average Read Rate = 340 MB per minute
i.e. around a 50 MB per minute over the earlier result.
Appendix: Additional Read Test Resource Usage Charts
See text above for explanation.
The Basic and S1 charts were very similar to the S0 chart, i.e. close to 100% read utilisation throughout (sorry, just too many charts to produce to create and include them all!).
Appendix: Additional Write Rate Consistency Charts
See text above for explanation.
