Power BI Nullable Column Merge Join Problems

  1. Overview
  2. Problem Summary
    1. Problem Part 1
    2. Problem Part 2
  3. Scenario Background
  4. Join Types Background
    1. Logical Joins
    2. Physical Joins
  5. Example Data
  6. Example Join
  7. Summary of Test Results
    1. Power BI against Snowflake Test Results
    2. Snowflake SQL against SQL Server Test Results
    3. Power BI against SQL Server Test Results
  8. Key Findings of Tests
  9. What Changes are Needed in Power BI and Snowflake
    1. Power BI
    2. Snowflake
  10. Power BI against Snowflake Tests
    1. Snowflake Setup
    2. Test 1 – Joining Nullable Columns
    3. Test 2 – Joining Filtered Nullable Columns
    4. Test 3 – Joining Nullable Columns Containing No Null Values
  11. Back to the Real World
  12. SQL Server SQL Tests
    1. SQL Server Setup
    2. Snowflake SQL against SQL Server Test Results
    3. Power BI against SQL Server Tests
  13. Revisiting Snowflake
    1. Test 4 – Power BI SQL Server Query executed against Snowflake
  14. Appendix: SQL Server Data Generation Process
    1. Download and Restore AdventureWorksDW
    2. Prepare AdventureWorksDW

Overview

This page starts with a summary of the problem then walks through some examples in Snowflake and SQL Server.

A quick note about downloads

For some reason, clicking the download links on this page doesn’t seem to download the files, but copying the links and pasting them into a new tab in Chrome does seem to work.

Problem Summary

There are two parts to this problem.

Problem Part 1

Power BI generates SQL that performs very poorly against Snowflake (and possibly other database platforms) when joining nullable columns, e.g. in the “Merge Queries” action in the Power BI query editor.

Specifically, the SQL generated prevents the use of the “hash join” physical join algorithm that has been one of the main algorithms used for decades by database engines when executing joins between large tables. This forces database engines to fall-back to using very inefficient physical joins (e.g. loop/cartesian join) that can perform orders of magnitude slower.

The reason why Power BI generates different SQL for non-nullable vs. nullable columns in a join is explained in the “Problem Part 2” section below.

Join Created By Power BI for non-nullable columns against Snowflake and SQL Server

X INNER JOIN Y
ON X.a = Y.b

Join Created By Power BI for nullable columns against Snowflake

X INNER JOIN Y
ON (X.a = Y.b and X.a IS NOT NULL and Y.b IS NOT NULL) OR (X.a IS NULL AND Y.b IS NULL)

Not only is this more convoluted than the SQL Server equivalent, it is particularly ugly SQL because Snowflake has a built-in function that expresses the intent much more clearly:

X INNER JOIN Y
ON EQUAL_NULL(X.a, Y.b)

Join Created By Power BI for nullable columns against SQL Server

X INNER JOIN Y
ON (X.a = Y.b) OR (X.a IS NULL AND Y.b IS NULL)

Full query examples are included later on this page.

Problem Part 2

On a more philosophical level, Power BI is matching null values just like any other value. This behaviour is very ill-advised in my opinion. NULL represents “no information”. It should not be treated as just another value, at least not without an option to control this behaviour.

For example, in a customer dimension, if there is a CustomerAlternateKey (as used in the example below), then it would be stupid to say all customers with a NULL CustomerAlternateKey are the same customer – and yet, in effect, because Power BI joins null values just like any other value, this is what it is doing. So both erroneous cross-matches and duplication will likely arise.

For example, consider the following simple customer and sales data:

If these sets of data were joined in SQL via inner join, the null values in the customer alternate key column and sale key column would not match each other, resulting in:

However, when these sets of data are joined via the “Merge Queries” inner join action in Power BI the resulting data is:

Note that Power BI has treated null like any other value and the join has duplicated sales. For analysts used to the behaviour of SQL, this is pretty wild behaviour.

A sample Power BI PBIX file containing the simple example above can be downloaded from here.

Scenario Background

We’ve recently moved to using Snowflake as our DW backend platform. It’s a fantastic modern machine, generally speaking able to easily process queries across large datasets – from performance, SQL-compatibility and cost perspectives. So we were puzzled when we saw a seemingly simple query generated by Power BI that was taking an extremely long time to execute (and on Snowflake, time=cost).

When I looked into the problem, I admit I was surprised at the cause of the problem and the rather naïve SQL generated by Power BI that seems to ignore how actual database engines in the real-world execute joins (specifically, they greatly prefer simple equality joins).

I’ve also recreated the scenario in both Snowflake and SQL Server using some sample data (based on AdventureWorksDW) for a couple of reasons:

  • I can’t share the original code since it is part of our internal DW – so using sample data is a simple alternative.
  • There are some commonalities and some differences in the behaviour of Power BI between the two platforms – but the behaviour in both is problematic.
  • The query plans in SQL Server are a bit richer (or at least I am more familiar with them) so are a helpful way to investigate the problem.
  • To show that this issue affects more than Snowflake (my hunch is most/all major DB platforms would be affected).
  • So that this blog post can hopefully be used to establish a conversation with Microsoft on the issue.

Join Types Background

Before we get into the detail, I am conscious some people may not understand what we mean by logical vs. physical join types, so here is a really quick intro.

Logical Joins

When most people talk about join types, they talk about inner, left outer, right outer, full outer, etc. These are logical joins, i.e. they describe functionally how data rows from two tables should be joined together. What they don’t describe is exactly how the database engine will execute the join internally.

Physical Joins

Physical joins describe the algorithm that a database engine will use to perform a logical join. So for example, let’s take an inner join… there are actually several different algorithms that SQL Server (or any database platform) could use to actually do the join. The end results will be the same* whichever algorithm is chosen, but each possible algorithm that could be used has different pros and cons. Some work faster for smaller row counts, some need sorted data, some require more memory to execute than others, etc. It is the job of the query optimiser inside the database engine to choose which physical join algorithm to use based on expected row counts and other factors.

(* well, not exactly the same – the resulting order of the data may be different for example).

It is generally always best to let the database engine choose which join algorithm to use. It is however possible to use query hints to control some aspects of the physical join in SQL Server, which is what we will do on this page to explore this problem.

For more information on logical and physical join types, see here.

Example Data

The scenario is that, as an analyst, we have some alternative sales data that is not yet in the star schema but is in a separate table named AlternativeSales. This data however joins to the DimCustomer table from the star schema via the CustomerAlternateKey column that is present in both tables.

The AlternativeSales table contains around 3.8 million rows and the DimCustomer table contains around 18 thousand rows.

The key things to note are that the CustomerAlternateKey is nullable and a small percentage of the rows in both tables have NULL values in the CustomerAlternateKey column.

If you are interested in how the data was produced, it is detailed in the appendix at the bottom on this page.

But all key columns should be “NOT NULL” in a star schema

This point is bound to come up at some point, so let’s get it out of the way here. In general I agree with this, but…

Whether we like it or not, the fact is Power BI is used in a range of scenarios today and analysts in the real-world are typically working with data from multiple/different sources – so in my view it’s just not credible to assume everyone will always be working only with well organised star schemas with well managed keys.

The data used in real-world analysis is often not just a simple star schema and analysts will often join data in ways that were not anticipated at design-time. (And we all know comparatively how long it takes to build star schemas, right?). I say all of this after 20 plus years of seeing how real-world teams work.

Power BI will always work best with star schemas, but I think it is wrong if very core Power BI functionality (like “Merge Queries”) only works in practice with pure star schemas.

Example Join

For discussion purposes, we will join the two tables to calculate the total sales amount by customer level of education (the field named EnglishEducation in DimCustomer). Writing this join in SQL, it would be:

SELECT c.EnglishEducation, SUM(s.SalesAmount) SalesAmount
FROM PbiJoinProblem.DimCustomer c
INNER JOIN PbiJoinProblem.AlternativeSales s
ON c.CustomerAlternateKey = s.CustomerAlternateKey
GROUP BY c.EnglishEducation
ORDER BY 1

Output:

EnglishEducation SalesAmount
Bachelors538,364,822.3616
Graduate Degree296,655,727.9488
High School248,237,764.3264
Partial College422,186,137.1904
Partial High School90,053,888.1984

Note that the customers and sales with NULL CustomerAlternateKey values have been eliminated.

Summary of Test Results

There are lots of different tests below. This section provides a quick reference summary of the test results below:

Power BI against Snowflake Test Results

With the exception of Tests 1b and 4, these tests were carried out in Power BI Desktop against Snowflake. Tests 1b and 4 were run in the Worksheets (query editor) in the Snowflake Snowsight web UI.

Test #Test DescriptionQuery TimeDuplicates
1aPower BI joining two tables with nullable columns9 min 38 secYes
1bAs 1a but simple SQL join criteria1 secNo
2As test 1 filtering but filtering out NULL values
from join columns
5 min 37 secNo
3As test 1 but no null key values in database tables2 secNo
4Direct SQL execution using simpler SQL join query
that Power BI Desktop generated for SQL Server
54 secYes

Snowflake SQL against SQL Server Test Results

These tests were taking the SQL generated in Tests 1 and 2 above, amending the syntax slightly to suit SQL Server rather than Snowflake (but not changing the join criteria) and then executing in SQL Server via SSMS.

Test #Test DescriptionQuery TimeDuplicates
1aSQL Server syntax SQL from Test 1a above1 min 3 secsYes
1bSQL Server syntax SQL from Test 1b above1 secNo
2SQL Server syntax SQL from Test 2 above1 secNo
3SQL Server syntax SQL from Test 3 above1 secNo

Power BI against SQL Server Test Results

These tests were carried out in Power BI Desktop against SQL Server.

Test #Test DescriptionQuery TimeDuplicates
1Power BI joining two tables with nullable columns2 secsYes
2As test 1 filtering but out NULL values from join columns5 secsNo

Key Findings of Tests

The SQL generated by Power BI against Snowflake (see Test 1) when joining nullable columns includes particularly convoluted join criteria. The join is more convoluted than the equivalent join generated by Power BI against SQL Server.

The SQL Server query optimiser also seems to have at least one join additional optimisation that Snowflake doesn’t have (compare the results of Snowflake Test 4 vs. Power BI against SQL Test 1) – however this only works because of the simpler join criteria generated by Power BI against SQL Server.

A great deal of this mess is caused by the fact Power BI insists on matching null values in joins in a way that SQL does not, i.e. null==null is TRUE in a Power BI join but FALSE in a SQL join.

What Changes are Needed in Power BI and Snowflake

Power BI

Change 1

An additional setting (checkbox) in Power BI Desktop in the “Merge Queries” function (i.e. an additional argument in the M Table.NestedJoin() function) that controls whether NULL values match in a join would be greatly beneficial. The checkbox could be named “Match NULL values” (default can be TRUE to match todays behaviour). If the checkbox was unticked, then the SQL generated should revert to the native SQL join types, e.g.

“Match NULL values” ticked (default):

X INNER JOIN Y 
ON (X.a = Y.b and X.a IS NOT NULL and Y.b IS NOT NULL) OR (X.a IS NULL AND Y.b IS NULL)

See “Change 2” below re: the superfluous SQL that is striked through above.

“Match NULL values” unticked:

X INNER JOIN Y
ON X.a = Y.b

This would solve both of the problems mentioned at the start of this page.

So as an example, we want to be able to generate this SQL against Snowflake:

select "ENGLISHEDUCATION",
    sum({ fn convert("SALESAMOUNT", SQL_DOUBLE) }) as "C1"
from 
(
    select "OTBL"."CUSTOMERALTERNATEKEY",
        "OTBL"."SALESAMOUNT",
        "ITBL"."ENGLISHEDUCATION"
    from "SBOX_CBAILISS_GENERAL"."S01_PBI_JOIN_PROBLEM"."ALTERNATIVESALES" as "OTBL"
    inner join "SBOX_CBAILISS_GENERAL"."S01_PBI_JOIN_PROBLEM"."DIMCUSTOMER" as "ITBL" on "OTBL"."CUSTOMERALTERNATEKEY" = "ITBL"."CUSTOMERALTERNATEKEY"
) as "ITBL"
group by "ENGLISHEDUCATION"
order by "ENGLISHEDUCATION"
LIMIT 1000 OFFSET 0

Instead of this more convoluted SQL:

select "ENGLISHEDUCATION",
    sum({ fn convert("SALESAMOUNT", SQL_DOUBLE) }) as "C1"
from 
(
    select "OTBL"."CUSTOMERALTERNATEKEY",
        "OTBL"."SALESAMOUNT",
        "ITBL"."ENGLISHEDUCATION"
    from "SBOX_CBAILISS_GENERAL"."S01_PBI_JOIN_PROBLEM"."ALTERNATIVESALES" as "OTBL"
    inner join "SBOX_CBAILISS_GENERAL"."S01_PBI_JOIN_PROBLEM"."DIMCUSTOMER" as "ITBL" on (("OTBL"."CUSTOMERALTERNATEKEY" = "ITBL"."CUSTOMERALTERNATEKEY" and not "OTBL"."CUSTOMERALTERNATEKEY" is null) and not "ITBL"."CUSTOMERALTERNATEKEY" is null or "OTBL"."CUSTOMERALTERNATEKEY" is null and "ITBL"."CUSTOMERALTERNATEKEY" is null)
) as "ITBL"
group by "ENGLISHEDUCATION"
order by "ENGLISHEDUCATION"
LIMIT 1000 OFFSET 0

Change 2

It would be better if Power BI could generate the same slightly simpler join SQL against Snowflake as it does against SQL Server (i.e. without the SQL striked through above). So even if the checkbox described above were checked to match null values in joins, the SQL generated by Power BI against Snowflake would look like:

select "ENGLISHEDUCATION",
    sum({ fn convert("SALESAMOUNT", SQL_DOUBLE) }) as "C1"
from 
(
    select "OTBL"."CUSTOMERALTERNATEKEY",
        "OTBL"."SALESAMOUNT",
        "ITBL"."ENGLISHEDUCATION"
    from "SBOX_CBAILISS_GENERAL"."S01_PBI_JOIN_PROBLEM"."ALTERNATIVESALES" as "OTBL"
    inner join "SBOX_CBAILISS_GENERAL"."S01_PBI_JOIN_PROBLEM"."DIMCUSTOMER" as "ITBL" on ("OTBL"."CUSTOMERALTERNATEKEY" = "ITBL"."CUSTOMERALTERNATEKEY") or ("OTBL"."CUSTOMERALTERNATEKEY" is null and "ITBL"."CUSTOMERALTERNATEKEY" is null)
) as "ITBL"
group by "ENGLISHEDUCATION"
order by "ENGLISHEDUCATION"
LIMIT 1000 OFFSET 0

Snowflake

If Power BI were able to generate the simpler SQL Server join SQL against Snowflake, then an optimisation is needed in Snowflake to allow HASH joins to be executed more efficiently for join criteria that looks like the join criteria immediately above, i.e.

X INNER JOIN Y 
ON (X.a = Y.b) OR (X.a IS NULL AND Y.b IS NULL)

This can equally be expressed in Snowflake as:

X INNER JOIN Y
ON EQUAL_NULL(X, Y)

e.g.

select "ENGLISHEDUCATION",
    sum({ fn convert("SALESAMOUNT", SQL_DOUBLE) }) as "C1"
from 
(
    select "OTBL"."CUSTOMERALTERNATEKEY",
        "OTBL"."SALESAMOUNT",
        "ITBL"."ENGLISHEDUCATION"
    from "SBOX_CBAILISS_GENERAL"."S01_PBI_JOIN_PROBLEM"."ALTERNATIVESALES" as "OTBL"
    inner join "SBOX_CBAILISS_GENERAL"."S01_PBI_JOIN_PROBLEM"."DIMCUSTOMER" as "ITBL" on EQUAL_NULL("OTBL"."CUSTOMERALTERNATEKEY", "ITBL"."CUSTOMERALTERNATEKEY")
) as "ITBL"
group by "ENGLISHEDUCATION"
order by "ENGLISHEDUCATION"
LIMIT 1000 OFFSET 0

Power BI against Snowflake Tests

Snowflake Setup

If you wish to create this in your own Snowflake environment, the create table scripts are below:

CREATE TABLE S01_PBI_JOIN_PROBLEM.DimCustomer(
	CustomerKey int NOT NULL,
	GeographyKey int NULL,
	CustomerAlternateKey nvarchar(15) NULL,
	Title nvarchar(8) NULL,
	FirstName nvarchar(50) NULL,
	MiddleName nvarchar(50) NULL,
	LastName nvarchar(50) NULL,
	NameStyle boolean NULL,
	BirthDate date NULL,
	MaritalStatus nchar(1) NULL,
	Suffix nvarchar(10) NULL,
	Gender nvarchar(1) NULL,
	EmailAddress nvarchar(50) NULL,
	YearlyIncome number NULL,
	TotalChildren tinyint NULL,
	NumberChildrenAtHome tinyint NULL,
	EnglishEducation nvarchar(40) NULL,
	SpanishEducation nvarchar(40) NULL,
	FrenchEducation nvarchar(40) NULL,
	EnglishOccupation nvarchar(100) NULL,
	SpanishOccupation nvarchar(100) NULL,
	FrenchOccupation nvarchar(100) NULL,
	HouseOwnerFlag nchar(1) NULL,
	NumberCarsOwned tinyint NULL,
	AddressLine1 nvarchar(120) NULL,
	AddressLine2 nvarchar(120) NULL,
	Phone nvarchar(20) NULL,
	DateFirstPurchase date NULL,
	CommuteDistance nvarchar(15) NULL
);
CREATE TABLE S01_PBI_JOIN_PROBLEM.AlternativeSales(
	CustomerAlternateKey nvarchar(15) NULL,
	ProductKey int NOT NULL,
	OrderDateKey int NOT NULL,
	CurrencyKey int NOT NULL,
	SalesOrderNumber nvarchar(20) NOT NULL,
	SalesOrderLineNumber tinyint NOT NULL,
	SalesAmount number(38, 12) NOT NULL
);

The tables can be loaded using:

copy into S01_PBI_JOIN_PROBLEM.DimCustomer
  from @LOADING.S3_STAGE/01-pbi-joining-problem/DimCustomer.txt.gz
  FILE_FORMAT = ( FORMAT_NAME = 'LOADING.GZIP_TSV');
  
copy into S01_PBI_JOIN_PROBLEM.AlternativeSales
  from @LOADING.S3_STAGE/01-pbi-joining-problem/AlternativeSales.txt.gz
  FILE_FORMAT = ( FORMAT_NAME = 'LOADING.GZIP_TSV');

The file format is defined as:

CREATE OR REPLACE FILE FORMAT LOADING.GZIP_TSV
    TYPE = CSV
    COMPRESSION = GZIP
    FIELD_DELIMITER = '\t'
    SKIP_HEADER = 1
    BINARY_FORMAT = BASE64;

The two data files used can be downloaded from:

http://misc.cbailiss.me.uk/pbijoin/DimCustomer.txt.gz
http://misc.cbailiss.me.uk/pbijoin/AlternativeSales.txt.gz

Test 1 – Joining Nullable Columns

We build two queries in the Power BI Query Builder and join them using “Merge Queries”, specifying the join type as “inner join”.

Query dependencies:

DimCustomer query:

AlternativeSales query (very slow to execute):

Both queries are disabled – neither is set to load into the data model as everything we need to do can be done in the query designer. We are only interested in the AlternativeSales query. This query takes an incredible 9 min 38 sec to execute.

The Power BI PBIX can be downloaded from here.

The results eventually are:

The numbers are hard to read above, but the level of double counting is clear. Instead of 538 million for the first number we now have 222 billion due to the Power BI null matching behaviour.

The SQL generated by Power BI is:

select "ENGLISHEDUCATION",
    sum({ fn convert("SALESAMOUNT", SQL_DOUBLE) }) as "C1"
from 
(
    select "OTBL"."CUSTOMERALTERNATEKEY",
        "OTBL"."SALESAMOUNT",
        "ITBL"."ENGLISHEDUCATION"
    from "SBOX_CBAILISS_GENERAL"."S01_PBI_JOIN_PROBLEM"."ALTERNATIVESALES" as "OTBL"
    inner join "SBOX_CBAILISS_GENERAL"."S01_PBI_JOIN_PROBLEM"."DIMCUSTOMER" as "ITBL" on (("OTBL"."CUSTOMERALTERNATEKEY" = "ITBL"."CUSTOMERALTERNATEKEY" and not "OTBL"."CUSTOMERALTERNATEKEY" is null) and not "ITBL"."CUSTOMERALTERNATEKEY" is null or "OTBL"."CUSTOMERALTERNATEKEY" is null and "ITBL"."CUSTOMERALTERNATEKEY" is null)
) as "ITBL"
group by "ENGLISHEDUCATION"
order by "ENGLISHEDUCATION"
LIMIT 1000 OFFSET 0

Note the convoluted join condition in the SQL above:

inner join "SBOX_CBAILISS_GENERAL"."S01_PBI_JOIN_PROBLEM"."DIMCUSTOMER" as "ITBL" on (("OTBL"."CUSTOMERALTERNATEKEY" = "ITBL"."CUSTOMERALTERNATEKEY" and not "OTBL"."CUSTOMERALTERNATEKEY" is null) and not "ITBL"."CUSTOMERALTERNATEKEY" is null or "OTBL"."CUSTOMERALTERNATEKEY" is null and "ITBL"."CUSTOMERALTERNATEKEY" is null)

This forces what Snowflake calls a cartesian join in the query plan (which I think is essentially the same as a loop join in SQL Server):

Look at the incredible number of rows (1.5 billion) coming out of the cartesian join!

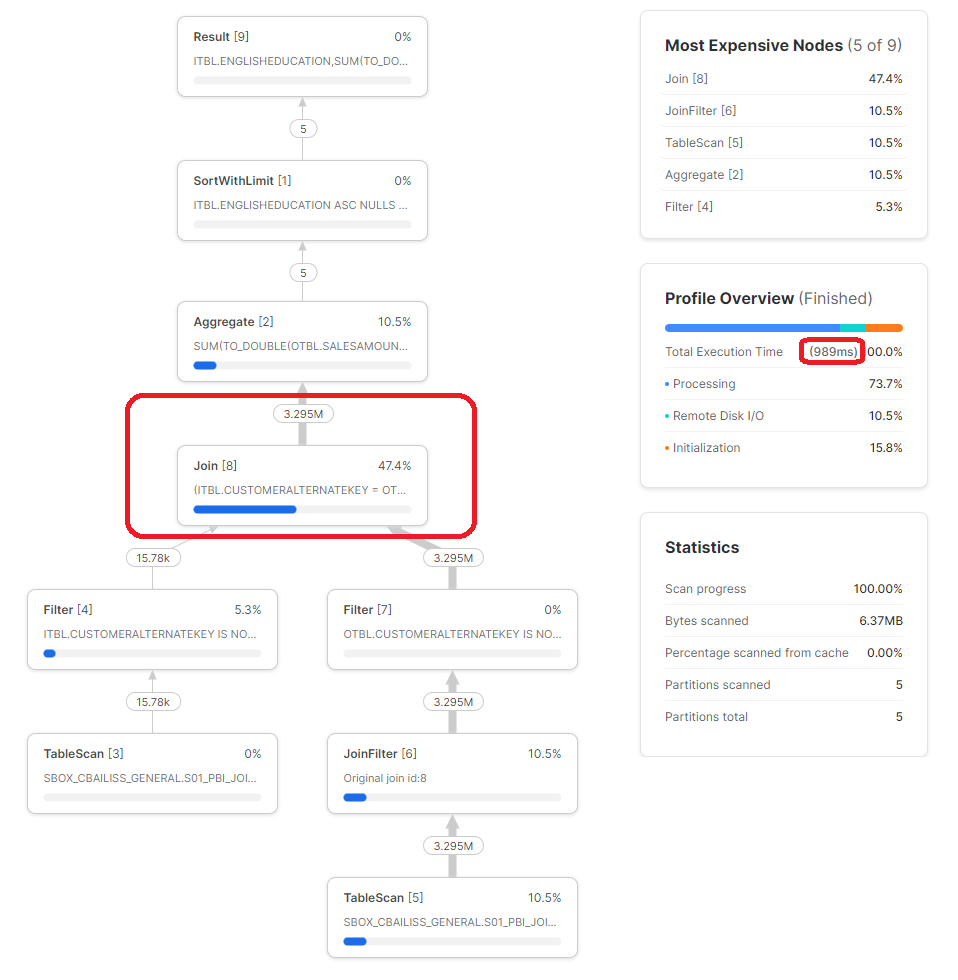
As a comparison, we can take the SQL generated by Power BI and simplify the join back to a simple inner join. We add in GETDATE() as a simple way of ensuring the query executes and the results do not come from the Snowflake results cache:

select "ENGLISHEDUCATION",
    sum({ fn convert("SALESAMOUNT", SQL_DOUBLE) }) as "C1",
    GETDATE()
from 
(
    select "OTBL"."CUSTOMERALTERNATEKEY",
        "OTBL"."SALESAMOUNT",
        "ITBL"."ENGLISHEDUCATION"
    from "SBOX_CBAILISS_GENERAL"."S01_PBI_JOIN_PROBLEM"."ALTERNATIVESALES" as "OTBL"
    inner join "SBOX_CBAILISS_GENERAL"."S01_PBI_JOIN_PROBLEM"."DIMCUSTOMER" as "ITBL" on "OTBL"."CUSTOMERALTERNATEKEY" = "ITBL"."CUSTOMERALTERNATEKEY"
)
group by "ENGLISHEDUCATION"
order by "ENGLISHEDUCATION"
LIMIT 1000 OFFSET 0;

As expected, this query executes in less than a second, produces the expected values and the query plan looks more sensible:

Test 2 – Joining Filtered Nullable Columns

A variation of the above test was carried out where the two queries in Power BI each had a step added that filtered out NULL CustomerAlternateKey values prior to the “Merge Queries” step.

The Power BI PBIX can be downloaded from here

This query generated the expected results (i.e. not double counting):

Power BI generated the following SQL for Snowflake:

select "ENGLISHEDUCATION",
    sum({ fn convert("SALESAMOUNT", SQL_DOUBLE) }) as "C1"
from 
(
    select "OTBL"."CUSTOMERALTERNATEKEY",
        "OTBL"."SALESAMOUNT",
        "ITBL"."ENGLISHEDUCATION"
    from 
    (
        select "CUSTOMERALTERNATEKEY",
            "SALESAMOUNT"
        from "SBOX_CBAILISS_GENERAL"."S01_PBI_JOIN_PROBLEM"."ALTERNATIVESALES"
        where not "CUSTOMERALTERNATEKEY" is null
    ) as "OTBL"
    inner join 
    (
        select "CUSTOMERALTERNATEKEY",
            "ENGLISHEDUCATION"
        from "SBOX_CBAILISS_GENERAL"."S01_PBI_JOIN_PROBLEM"."DIMCUSTOMER"
        where not "CUSTOMERALTERNATEKEY" is null
    ) as "ITBL" on (("OTBL"."CUSTOMERALTERNATEKEY" = "ITBL"."CUSTOMERALTERNATEKEY" and not "OTBL"."CUSTOMERALTERNATEKEY" is null) and not "ITBL"."CUSTOMERALTERNATEKEY" is null or "OTBL"."CUSTOMERALTERNATEKEY" is null and "ITBL"."CUSTOMERALTERNATEKEY" is null)
) as "ITBL"
group by "ENGLISHEDUCATION"
order by "ENGLISHEDUCATION"
LIMIT 1000 OFFSET 0

Note the additional sub-queries in the SQL, each containing a WHERE clause to eliminate null values.

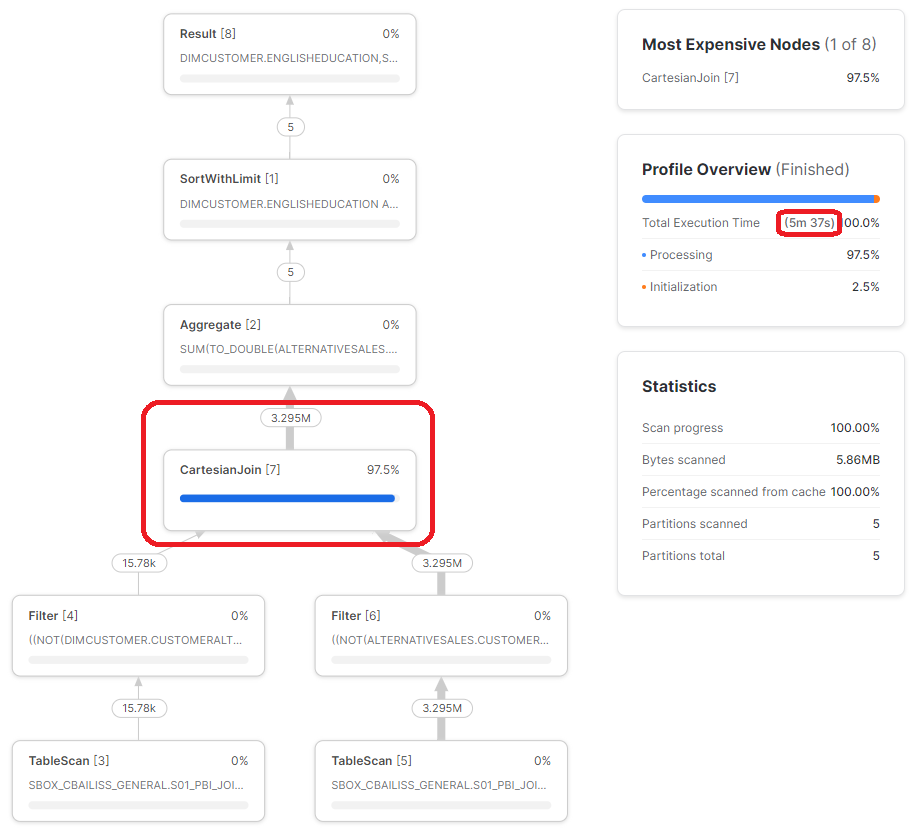
This resulted in a query that was a little quicker to execute (5 min 37 secs) but was still ultimately very slow compared to the optimum query. Even though the null values have been eliminated, Snowflake still executed the query with a cartesian join.
Test 3 – Joining Nullable Columns Containing No Null Values

As a quick final test, I deleted the rows from each table containing NULL CustomerAlternateKey values and then executed the original queries from the PBIX file used in Test 1. In this case, the query executed in a couple of seconds. Either Power BI recognised there were no null values present and generated the simpler SQL or Snowflake used data statistics to recognise no null values are present.

While this is an interesting result, it is not really relevant to the main problem – which is how Power BI joins two tables when null values are present.

Back to the Real World

In our internal DW, the tables that we were joining were significantly bigger (20 million rows in each) and the cartesian join resulted in a Snowflake query execution time that was predicted to be four days (the query was stopped after 1 hour). As an interesting aside, at standard Snowflake pay-as-you-go rates, that query would have cost $480 and produced meaningless junk.

As a comparison, when the simple inner join query was executed with our internal DW data, Snowflake was able to complete the query (joining 20 million rows) in a couple of seconds. 4 days vs. a couple of seconds!

SQL Server SQL Tests

To look at the problem from a different perspective, we will now investigate it in SQL Server.

We will approach this in two parts. Firstly, we will execute the SQL we captured above in SSMS against SQL Server, to see the join algorithms that SQL Server is able to use. Then we will build the same test cases in Power BI Desktop that we used against Snowflake above to see how Power BI generates the equivalent SQL for SQL Server.

SQL Server Setup

A SQL Server 2019 database backup file containing test data can be downloaded from here.

Snowflake SQL against SQL Server Test Results

Test 1 – Joining Nullable Columns

The SQL from Snowflake Test 1 above written in SQL Server syntax is:

select TOP 1000 ENGLISHEDUCATION,
    sum({ fn convert(SALESAMOUNT, SQL_DOUBLE) }) as C1
from 
(
    select OTBL.CUSTOMERALTERNATEKEY,
        OTBL.SALESAMOUNT,
        ITBL.ENGLISHEDUCATION
    from PbiJoinProblem.ALTERNATIVESALES as OTBL
    inner join PbiJoinProblem.DIMCUSTOMER as ITBL on ((OTBL.CUSTOMERALTERNATEKEY = ITBL.CUSTOMERALTERNATEKEY and not OTBL.CUSTOMERALTERNATEKEY is null) and not ITBL.CUSTOMERALTERNATEKEY is null or OTBL.CUSTOMERALTERNATEKEY is null and ITBL.CUSTOMERALTERNATEKEY is null)
) as ITBL
group by ENGLISHEDUCATION
order by ENGLISHEDUCATION

The query results include the double counting:

The query executed in 1 min 3 secs using a loop join physical join and possibly (if I am interpreting the query correctly) a hash match to pre-aggregate the data prior to joining – which for this set of data (lots of duplicate rows) works well to reduce the number of rows that need processing by the loop join – but would perhaps be of limited value with real data:

Right click on the image and select “Open image in new tab” to see full size, removing “?w=…” from the URL.

We can execute the simple inner loop version from Test 1:

select TOP 1000 ENGLISHEDUCATION,
    sum({ fn convert(SALESAMOUNT, SQL_DOUBLE) }) as C1
from 
(
    select OTBL.CUSTOMERALTERNATEKEY,
        OTBL.SALESAMOUNT,
        ITBL.ENGLISHEDUCATION
    from PbiJoinProblem.ALTERNATIVESALES as OTBL
    inner join PbiJoinProblem.DIMCUSTOMER as ITBL on OTBL.CUSTOMERALTERNATEKEY = ITBL.CUSTOMERALTERNATEKEY
) as ITBL
group by ENGLISHEDUCATION
order by ENGLISHEDUCATION

This executes in 1 sec and produces the expected results (no double counting):

The query plan included the hash join physical join:

Right click on the image and select “Open image in new tab” to see full size, removing “?w=…” from the URL.

If you try and force a hash join in the first query above by adding the HASH hint, an error results because this join criteria cannot be processed by a hash join:

select TOP 1000 ENGLISHEDUCATION,
    sum({ fn convert(SALESAMOUNT, SQL_DOUBLE) }) as C1
from 
(
    select OTBL.CUSTOMERALTERNATEKEY,
        OTBL.SALESAMOUNT,
        ITBL.ENGLISHEDUCATION
    from PbiJoinProblem.ALTERNATIVESALES as OTBL
    inner HASH join PbiJoinProblem.DIMCUSTOMER as ITBL on ((OTBL.CUSTOMERALTERNATEKEY = ITBL.CUSTOMERALTERNATEKEY and not OTBL.CUSTOMERALTERNATEKEY is null) and not ITBL.CUSTOMERALTERNATEKEY is null or OTBL.CUSTOMERALTERNATEKEY is null and ITBL.CUSTOMERALTERNATEKEY is null)
) as ITBL
group by ENGLISHEDUCATION
order by ENGLISHEDUCATION

Error:

Msg 8622, Level 16, State 1, Line 1
Query processor could not produce a query plan because of the hints defined in this query. Resubmit the query without specifying any hints and without using SET FORCEPLAN.

This is the essence of the performance problem caused by the SQL generated by Power BI when joining nullable columns – the most common/efficient physical join algorithm is unable to process the join criteria.

Test 2 – Joining Filtered Nullable Columns

The SQL from Snowflake Test 2 above written in SQL Server syntax is:

select TOP 1000 ENGLISHEDUCATION,
    sum({ fn convert(SALESAMOUNT, SQL_DOUBLE) }) as C1
from 
(
    select OTBL.CUSTOMERALTERNATEKEY,
        OTBL.SALESAMOUNT,
        ITBL.ENGLISHEDUCATION
    from 
    (
        select CUSTOMERALTERNATEKEY,
            SALESAMOUNT
        from PbiJoinProblem.ALTERNATIVESALES
        where not CUSTOMERALTERNATEKEY is null
    ) as OTBL
    inner join 
    (
        select CUSTOMERALTERNATEKEY,
            ENGLISHEDUCATION
        from PbiJoinProblem.DIMCUSTOMER
        where not CUSTOMERALTERNATEKEY is null
    ) as ITBL on ((OTBL.CUSTOMERALTERNATEKEY = ITBL.CUSTOMERALTERNATEKEY and not OTBL.CUSTOMERALTERNATEKEY is null) and not ITBL.CUSTOMERALTERNATEKEY is null or OTBL.CUSTOMERALTERNATEKEY is null and ITBL.CUSTOMERALTERNATEKEY is null)
) as ITBL
group by ENGLISHEDUCATION
order by ENGLISHEDUCATION

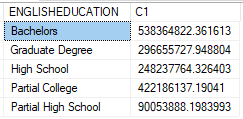
The query results correctly do not include the double counting:
The query executes in around 1 sec, i.e. SQL Server is able to use the more optimal HASH join algorithm:

Right click on the image and select “Open image in new tab” to see full size, removing “?w=…” from the URL.

Test 3 – Joining Nullable Columns Containing No Null Values

If we delete the rows containing null CustomerAlternateKey values in both tables, and try executing the first SQL query for SQL Server Test 1 above, we get the same SQL Server behaviour – i.e. SQL Server appears not to use statistics to determine whether null values actually exist in order to use a HASH join.

Power BI against SQL Server Tests

Power BI often does not generate the same SQL against different data sources. So, let’s build the same queries in Power BI Desktop against SQL, including the “Merge Queries” action and look at the SQL that is generated.

Test 1 – Joining Nullable Columns

Attempting to build the queries in Power BI Desktop is painful. When adding the “Merge Queries” step, the Query Builder gets stuck reading data incredibly slowly:

It appears to be attempting to perform the join in Power BI instead of using SQL Server to perform the join.

For the PBIX file at this point, see SQL Server Example 1 from here.

To work around this problem I temporarily added a “Keep Top 1000” step before the “Merge Queries” step. This allowed me to build the rest of the query. I could then remove the “Keep Top 1000” step however if I accidentally clicked on the “Merged Queries” step, Power BI Desktop would again try to download all of the data (this is painful to work with!).

For the PBIX file at this point, see SQL Server Example 2 from here.

The final query was now able to execute:

As we might assume by now, the results include the double counting:

The SQL generated was:

select top 1000
    [_].[EnglishEducation],
    [_].[SalesAmount]
from 
(
    select [rows].[EnglishEducation] as [EnglishEducation],
        sum([rows].[SalesAmount]) as [SalesAmount]
    from 
    (
        select [$Outer].[CustomerAlternateKey],
            [$Outer].[SalesAmount],
            [$Inner].[EnglishEducation]
        from 
        (
            select [CustomerAlternateKey],
                [SalesAmount]
            from [PbiJoinProblem].[AlternativeSales] as [$Table]
        ) as [$Outer]
        inner join 
        (
            select [CustomerAlternateKey] as [CustomerAlternateKey2],
                [EnglishEducation] as [EnglishEducation]
            from [PbiJoinProblem].[DimCustomer] as [$Table]
        ) as [$Inner] on ([$Outer].[CustomerAlternateKey] = [$Inner].[CustomerAlternateKey2] or [$Outer].[CustomerAlternateKey] is null and [$Inner].[CustomerAlternateKey2] is null)
    ) as [rows]
    group by [EnglishEducation]
) as [_]
order by [_].[EnglishEducation]

Interestingly, even given the slightly non-trivial join condition, the query executed in only a couple of seconds. The query plan was:

Right click on the image and select “Open image in new tab” to see full size, removing “?w=…” from the URL.

The above is interesting, it shows that Power BI is generating a simple SQL query for SQL Server than it does for Snowflake. This query can fully execute using the HASH join physical join. We will test this version of the query against Snowflake later further below on this page (see Test 4 section further below).

Test 2 – Joining Filtered Nullable Columns

For completeness, we’ll filter the two tables in Power BI to exclude NULL CustomerAlternateKey values before the merge join.

For the PBIX file at this point, see SQL Server Example 3 from here.

The results of this in Power BI, as expected, do not include the double counting:

The SQL generated by Power BI was:

select top 1000
    [_].[EnglishEducation],
    [_].[SalesAmount]
from 
(
    select [rows].[EnglishEducation] as [EnglishEducation],
        sum([rows].[SalesAmount]) as [SalesAmount]
    from 
    (
        select [$Outer].[CustomerAlternateKey],
            [$Outer].[SalesAmount],
            [$Inner].[EnglishEducation]
        from 
        (
            select [_].[CustomerAlternateKey],
                [_].[SalesAmount]
            from 
            (
                select [CustomerAlternateKey],
                    [SalesAmount]
                from [PbiJoinProblem].[AlternativeSales] as [$Table]
            ) as [_]
            where [_].[CustomerAlternateKey] is not null
        ) as [$Outer]
        inner join 
        (
            select [_].[CustomerAlternateKey] as [CustomerAlternateKey2],
                [_].[EnglishEducation] as [EnglishEducation]
            from 
            (
                select [CustomerAlternateKey],
                    [EnglishEducation]
                from [PbiJoinProblem].[DimCustomer] as [$Table]
            ) as [_]
            where [_].[CustomerAlternateKey] is not null
        ) as [$Inner] on ([$Outer].[CustomerAlternateKey] = [$Inner].[CustomerAlternateKey2] or [$Outer].[CustomerAlternateKey] is null and [$Inner].[CustomerAlternateKey2] is null)
    ) as [rows]
    group by [EnglishEducation]
) as [_]
order by [_].[EnglishEducation]

This features IS NOT NULL WHERE clauses as expected and still features the simpler join criteria than was generated against Snowflake. The query executed in around 5 seconds using the following query plan:

Right click on the image and select “Open image in new tab” to see full size, removing “?w=…” from the URL.

Revisiting Snowflake

Test 4 – Power BI SQL Server Query executed against Snowflake

We take the Test 1 query generated by Power BI against SQL Server and test executing this against Snowflake. The SQL is:

select "ENGLISHEDUCATION",
    sum({ fn convert("SALESAMOUNT", SQL_DOUBLE) }) as "C1"
from 
(
    select "OTBL"."CUSTOMERALTERNATEKEY",
        "OTBL"."SALESAMOUNT",
        "ITBL"."ENGLISHEDUCATION"
    from "SBOX_CBAILISS_GENERAL"."S01_PBI_JOIN_PROBLEM"."ALTERNATIVESALES" as "OTBL"
    inner join "SBOX_CBAILISS_GENERAL"."S01_PBI_JOIN_PROBLEM"."DIMCUSTOMER" as "ITBL" on (("OTBL"."CUSTOMERALTERNATEKEY" = "ITBL"."CUSTOMERALTERNATEKEY") or "OTBL"."CUSTOMERALTERNATEKEY" is null and "ITBL"."CUSTOMERALTERNATEKEY" is null)
) as "ITBL"
group by "ENGLISHEDUCATION"
order by "ENGLISHEDUCATION"
LIMIT 1000 OFFSET 0

As you might assume, the results include the double counting:

The query execution time was significantly improved at 54 seconds (instead of 9 minutes plus), but this is still much slower than the simple join execution time in Snowflake (less than 1 second). The query plan doesn’t feature the cartesian join but still features an ugly large number of rows after the join:

Appendix: SQL Server Data Generation Process

Download and Restore AdventureWorksDW

Download the AdventureWorksDW database from here. Note – ensure you download the DW version, not the OLTP version. For the record, I ran the code on this page using SQL Server 2019.

Restore the database into your SQL Server.

Prepare AdventureWorksDW

The following script created the test tables/data:

CREATE SCHEMA PbiJoinProblem;

CREATE TABLE PbiJoinProblem.[DimCustomer](
	[CustomerKey] [int] NOT NULL,
	[GeographyKey] [int] NULL,
	[CustomerAlternateKey] [nvarchar](15) NULL,
	[Title] [nvarchar](8) NULL,
	[FirstName] [nvarchar](50) NULL,
	[MiddleName] [nvarchar](50) NULL,
	[LastName] [nvarchar](50) NULL,
	[NameStyle] [bit] NULL,
	[BirthDate] [date] NULL,
	[MaritalStatus] [nchar](1) NULL,
	[Suffix] [nvarchar](10) NULL,
	[Gender] [nvarchar](1) NULL,
	[EmailAddress] [nvarchar](50) NULL,
	[YearlyIncome] [money] NULL,
	[TotalChildren] [tinyint] NULL,
	[NumberChildrenAtHome] [tinyint] NULL,
	[EnglishEducation] [nvarchar](40) NULL,
	[SpanishEducation] [nvarchar](40) NULL,
	[FrenchEducation] [nvarchar](40) NULL,
	[EnglishOccupation] [nvarchar](100) NULL,
	[SpanishOccupation] [nvarchar](100) NULL,
	[FrenchOccupation] [nvarchar](100) NULL,
	[HouseOwnerFlag] [nchar](1) NULL,
	[NumberCarsOwned] [tinyint] NULL,
	[AddressLine1] [nvarchar](120) NULL,
	[AddressLine2] [nvarchar](120) NULL,
	[Phone] [nvarchar](20) NULL,
	[DateFirstPurchase] [date] NULL,
	[CommuteDistance] [nvarchar](15) NULL
);

INSERT INTO PbiJoinProblem.DimCustomer
SELECT [CustomerKey]
      ,[GeographyKey]
      ,CASE WHEN ABS(CHECKSUM(NewId())) % 14 > 11 THEN NULL ELSE [CustomerAlternateKey] END
      ,[Title]
      ,[FirstName]
      ,[MiddleName]
      ,[LastName]
      ,[NameStyle]
      ,[BirthDate]
      ,[MaritalStatus]
      ,[Suffix]
      ,[Gender]
      ,[EmailAddress]
      ,[YearlyIncome]
      ,[TotalChildren]
      ,[NumberChildrenAtHome]
      ,[EnglishEducation]
      ,[SpanishEducation]
      ,[FrenchEducation]
      ,[EnglishOccupation]
      ,[SpanishOccupation]
      ,[FrenchOccupation]
      ,[HouseOwnerFlag]
      ,[NumberCarsOwned]
      ,[AddressLine1]
      ,[AddressLine2]
      ,[Phone]
      ,[DateFirstPurchase]
      ,[CommuteDistance]
FROM dbo.DimCustomer;

CREATE TABLE PbiJoinProblem.AlternativeSales
(
	[CustomerAlternateKey] [nvarchar](15) NULL,
	[ProductKey] [int] NOT NULL,
	[OrderDateKey] [int] NOT NULL,
	[CurrencyKey] [int] NOT NULL,
	[SalesOrderNumber] [nvarchar](20) NOT NULL,
	[SalesOrderLineNumber] [tinyint] NOT NULL,
	[SalesAmount] [money] NOT NULL
);

ALTER TABLE PbiJoinProblem.AlternativeSales REBUILD PARTITION = ALL WITH (DATA_COMPRESSION = PAGE);

INSERT INTO PbiJoinProblem.AlternativeSales
SELECT dc.CustomerAlternateKey, f.ProductKey, f.OrderDateKey, f.CurrencyKey, 
	substring(CAST(newid() as varchar(50)),1,20), f.SalesOrderLineNumber, f.SalesAmount
FROM dbo.FactInternetSales f
INNER JOIN PbiJoinProblem.DimCustomer dc
ON f.CustomerKey = dc.CustomerKey;

-- run the following repeatedly (5-6 times to generate a few million rows in AlternativeSales table)
INSERT INTO PbiJoinProblem.AlternativeSales
SELECT CustomerAlternateKey, ProductKey, OrderDateKey, CurrencyKey, 
	substring(CAST(newid() as varchar(50)),1,20), SalesOrderLineNumber, SalesAmount
FROM PbiJoinProblem.AlternativeSales

All tables other than the two tables created above were then dropped from the database.

Azure SQL Data Warehouse, Power BI and old problems

Azure SQL Data Warehouse is a fantastic MPP solution that puts an incredible amount of data storage and processing power at your fingertips.  With all of the benefits of the cloud and great SQL Server compatibility as well.

Power BI has native connectivity to  Azure SQL DW, including via Direct Query, allowing interactive reports to be run over extremely large data volumes.

One niggle is the inherent limitation in Power BI of only being able to create one relationship between each table.  For one of my recent use cases with Azure SQL DW, this Power BI limitation meant it wasn’t possible to have Power BI generate queries that are optimum.

Generally speaking with Azure SQL DW, eliminating/minimising the data movement between the compute nodes in query plans is a good thing.  In my scenario, I could easily hand write a SQL query that minimised data movement by including an extra join condition.  Power BI can’t generate this extra condition however, so that plan isn’t so optimised.

All the details are here:

https://community.powerbi.com/t5/Integrations-with-Files-and/Does-Power-BI-fully-support-Azure-SQL-Data-Warehouse/m-p/90435

It’s a modern example of the age-old problem that handwritten code can usually be written that outperforms machine written code.  We have all shiny new technology, and incredible technology it certainly is, but often the age-old niggles are still there…

UPDATE  14th May 2018:  The Power BI team has added the COMBINEVALUES() function, which helps greatly with the above problem.  Details already blogged at:

https://www.sqlbi.com/articles/using-combinevalues-to-optimize-directquery-performance

Azure Increases SQL Database Performance

Microsoft have recently increased the performance across all service tiers at no additional cost:

  • Write performance is doubled for all service tiers
  • Read performance is doubled for the Premium service tiers.

The official announcement is here.

For the benefit of anyone reading the older posts below, please remember some of the numbers should (in theory) be doubled.

Azure SQL DB: Quick Retests of Standard Tier

For a current piece of work, I needed updated information about Standard Tier capabilities in Azure SQL Database, especially raw write capability.  In my main v12 testing in Jan 2015, Microsoft were still adjusting v12 write performance for the Standard Tier.

Therefore, I have done a few quick retests.  Results:

  • S0 write:  24 MB per minute = 0.4 MB per second.
  • S1 write:  36 MB per minute = 0.6 MB per second.
  • S2 write:  48 MB per minute = 0.8 MB per second.

This shows Microsoft have adjusted the performance of S0 to S2 downwards from the performance in Jan 2015.  This is not surprising, since the results in Jan 2015 showed S0 and S1 had roughly equal performance, with S2 significantly more (even higher than S3).

I also ran the memory tests again.  The results reasonably closely matched my earlier tests (i.e. S0 = 500 MB, S1 = 990 MB, S2 = 2.2 GB).

It is worth noting that some blog posts have appeared over the past few months (e.g. here) that talk about using dm_os_performance_counters to obtain memory information.  For standard tier at least, I don’t believe these numbers are what they appear to be.  For example, target server memory using this DMV for both S1 and S2 is 3GB.  The dm_db_resource_stats DMV numbers suggest it is impossible to utilise 3 GB of memory on either an S1 or S2.

(All methodologies in these retests were the same as in the earlier tests).

Azure SQL Database: v12 GA Performance inc. CPU Benchmaring

Introduction

Version 12 of Azure SQL Database has now reached General Availability in Europe.  See the announcement here.  So, now it is time to re-run those earlier performance tests, to see where performance has settled at.

This post includes:

  • updated read / write metrics
  • a new CPU benchmark and
  • updated memory allocation metrics.

Microsoft publish very few absolute performance metrics regarding Azure SQL Database.  The tests described here involve indirectly calculating absolute metrics.  Methodologies are described below.

All tests were conducted at least three times to check for consistency and to reduce the risk of any random variations affecting the results.  (That is a lot of tests, data collection and processing – nearly 80 test runs in total).

For reference, these tests were conducted in the Western Europe data centre, against the following Azure SQL Database version (select @@version):

  • Microsoft SQL Azure (RTM) – 12.0.2000.8   Jan 29 2015 07:51:58

Unit of Measure

Note that the unit of measure for throughput rates in this post (and the other posts in this series) are MB per minute.  This is primarily because, at the lower tiers (and even the higher tiers until recently), rates of MB per second would be 0.xx, 1.xx, etc.  As the throughput rates have been increased, particularly recently, this has led to the higher performance level rates entering the thousands, so we have the opposite problem (i.e. too large numbers at the top end).  Still, despite that, I have opted to retain the same unit of measure throughout, to keep comparisons easier.  In the future, I may move to MB per second, if I get a lot of feedback in that direction.

Read Rate Tests

The test is based around reading data from a series of identical tables.  The tables contain a mixture of basic data types – no large object data types, all in-row data.  Average row size is around 410 bytes.

The test involved using a set of test data that is likely much larger than the SQL Buffer Pool sizes:

  • Basic: 1.9 GB
  • Standard S0:  10 GB
  • Standard S1:  20 GB
  • Standard S2:  30 GB
  • Standard S3:  36 GB
  • Premium P1 and P2:  36 GB

A new database was created in each service level and populated to the sizes given above.  The database was then copied (using the Database Copy facility).  My understanding is that this performs a physical copy of the database files (determined from some other tests I have undertaken previously) and results in a new database which has an empty buffer pool i.e. no data cached in memory.  The test then involves sequentially reading through the database reading data from disk allowing the maximum physical disk read rate to be measured.

Data was divided into 1 GB tables (100 MB tables for Basic Tier) and each table was read sequentially.

The SQL statements used to read through the database were similar to the following:

select count(*) from Table0
where [Bit1] is not null and
[TinyInt1] between 10 and 240 and
[Int3] between 100000 and 2000000000 and
[Money2] between 0 and 10000000

No indexes (other than a clustered index on the RowId primary key) were present on the tables.  A count(*) was used to ensure performance is not held back either by complex processing or by waiting for slow network I/O returning results to the client.

Results

20150131_01_read1

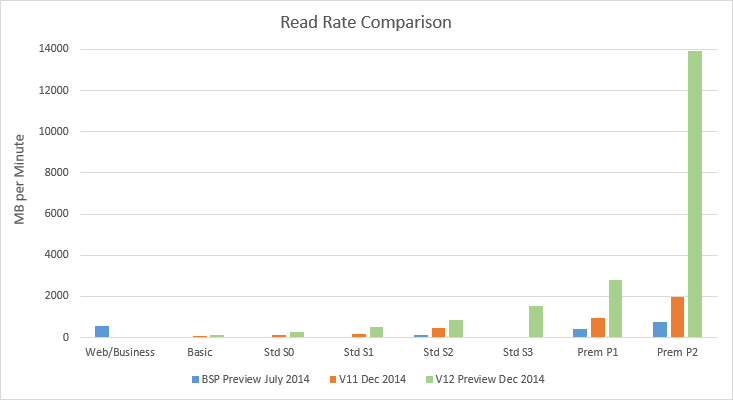
The blue bars show performance values obtained in my first tests in July 2014 during the preview of the newer service tiers (Basic, Standard and Premium).  The red bars show performance in the current generally available version (i.e. V11) of SQL Database.  V12 preview performance, measured in December 2014, is shown in the green bars.  The orange bars show V12 GA performance (except for Web/Business, which only exists at v11 – the orange Web/Business bar shows the result of a v11 test conducted in January 2015).

Premium P1 and P2 were also tested:

20150131_02_read2

Several interesting observations here.  Most notably, Premium P1 and P2 have received very significant read performance increases.  Premium performance now makes Web/Business performance appear tiny in comparison.  With this performance we can perhaps now understand why Microsoft set the Premium Tier prices so expensively in comparison to Web/Business.  No doubt, last summer when the Premium Tier pricing was announced, it was with this performance level in mind.  I expect Microsoft faced an interesting dilemma last year, do they pitch the initial Premium tier price lower in July 2014 (in line with the initial lower performance) and then dramatically increase it in January 2015 as this v12 upgrade comes on-line (and annoy customers in Jan 2015), or do they set it higher from the start (at the risk of making Premium look very poor value initially).  Obviously they chose the latter, and now the full story is becoming clearer.

This is a good point to note that at the beginning of these tests, the SQL Server Buffer Pool was empty (verified by checking the memory usage column in the sys.dm_db_resource_states DMV).  In addition, five to six hours had also elapsed between the creation of the database copies and the running of the tests, which should reduce potential effects from storage layer caching (though there is no way to verify this).  Thus the tests should be measuring the read rate from disk, not cache.

Standard Tier v12 GA performance for S1, S2 and S3 is significantly less than in preview.  However, it would not be fair to criticise Microsoft for any performance changes here.  It was quite clearly stated during the preview that performance could/would be adjusted as the service heads towards general availability.

More important is the comparison between current v11 performance and v12 GA performance.  Here we can see that maximum read rates under S0 and S1 have more than doubled.  S0 and S2 have received a slight increase.  Curiously Basic tier seems to have received a slight decrease.

It is particularly interesting to see where S2 and S3 read performance now sits.  S2 runs at almost the exact average of Web/Business.  Current Web/Business read performance is on average around 550 MB per minute though is quite volatile flipping between 200 MB per minute and 800 MB per minute (see my previous post here for more details).

S3 runs at on average 900 MB per minute – i.e. well above the average Web/Business performance and above even the Web/Business peak rates.

There is a wide gap between S3 performance and P1 performance.  Both S3 and P1 are rated at 100 DTUs, though P1 costs five times as much as S3.  Clearly, for that price difference you get a massive amount of extra read-performance.  This suggests that the DTU figures do not take into account I/O performance limits/variations between tiers / performance levels.

Read Rate Consistency

The following charts show how the read rates varied over the duration of the tests.  Each read test was performance three times at each performance level – labelled as (a), (b) and (c) in the charts:

20150131_10_read

A point is plotted on the chart for each table read during the test.  For Basic tier, each table contained 100 MB (showing first  1GB only on the chart).  For the other service tiers, each table contained 1 GB.

The chart shows that read rates were generally very consistent throughout.  Continuing with the other service tiers:

20150131_11_read

S1 read performance was generally consistent, S2 read performance varied a little but there does seem to be some quite wide variation of S3 read performance.  For P1 and P2:

20150131_12_read

Again, both P1 and P2 are reasonably consistent in their performance.  The P2a test run was a little more variable than the other two P2 tests.  S3 is shown on this chart to illustrate just how much higher Premium performance is than S3.  On this chart, the scale is such that the relatively wider variation in S3 performance (shown on the previous chart) is barely even visible here.

Read Test Resource Usage

During the read tests, the data from the sys.dm_db_resource_stats DMV was captured.  This showed that, in the S0, S1 and S2 tests, around 90% of the available read IO resources were being consumed, so these results should be a good reflection of the maximum rates available.

The S3 result was a little more volatile, showing that at times significantly less than 100% of the available read resources were being consumed.

20150131_15_read

As you may expect, the drops in read utilisation are generally speaking at the same points in the test as the drops in read rate occur (e.g. for at 8 GB in S3b and 22 GB in S3c).  This suggests the I/O subsystem was unable to supply the maximum amount of data per second that SQL Server could consume in this performance level.  All in all this suggests that Microsoft still need to apply some performance optimisations for S3.

Interestingly, the chart for P2 also shows that it was not consuming all of the theoretically available read resources:

20150131_17_read

This chart has less detail than previous charts.  This is because P2 read the test database very quickly, and there is only one row in the sys.dm_db_resource_stats DMV for every fifteen seconds.  Even still, the general trend is still clear enough.  The test query was consuming only around 70% of the available read resources during the test.

Knowing that the P2 test read on average at 19,500 MB per minute at 70% read utilisation, we can estimate that the theoretical P2 maximum read rate would be around 28 GB per minute.  Similarly, we can estimate that the maximum theoretical read rate for P1 (which was reading 11,800 MB per minute on average at 80% read utilisation) would be around 15 GB per minute.

More Read Utilisation charts for the other performance levels can be found in an appendix at the end of this article.

Write Rate Tests

This test aimed to cache a relatively small amount of data in the buffer pool (100 MB), then repeatedly write this until a specified total data volume had been written.  Each 100 MB chunk was written using a single Insert statement.  The total data volume was specified to aim for a test very roughly around 30 minutes to 1 hour in length  The time taken would then allow an estimate of the maximum write rate.  Total data volumes used were:

  • Basic and S0 – 1 GB.
  • S1, S2 and S3 – 2 GB.
  • P1 – 5 GB.
  • P2 – 10 GB.

Results

20150131_03_write1

Both Basic Tier and all four performance levels within Standard Tier have received notable write rate increases.

However the first question here is this: why is S3 write performance notably less than S2 write performance?  Tests at both S2 and S3 were repeated three times each – the results were consistent in all cases.  This seems very strange and I have put this question to Microsoft.

Edit:  I have received a response from Microsoft that the current write rates for the Standard Tiers are in v12 are about to be adjusted.  Once this has been completed I will update the details here.

It is interesting to note however, that none of the performance levels in Standard Tier come close to matching the Web/Business write performance.  Having said that, if S3 write performance was actually above S2 (as surely it is supposed to be) than S3 may actually come close to Web/Business.  I can see this being a key question for many existing Web/Business customers.

Moving on to write performance of the Premium Tier:

20150131_04_write2

P1 and P2 see significant write performance increases – a factor of almost three over current v11.  P1 write performance is now clearly higher than Web/Business – which is not the case in v11.  v12 P1 writes also outperform v11 P2.

Write Rate Consistency

The following charts show how the write rates varied over the duration of the tests.  Each write test was performance three times at each performance level – labelled as (a), (b) and (c) in the following charts.

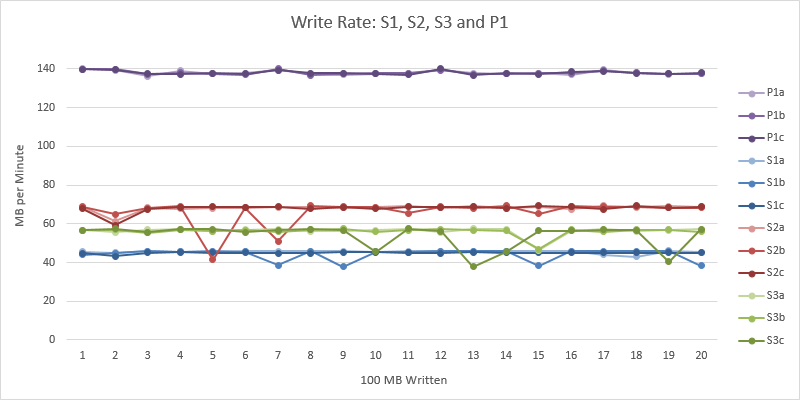
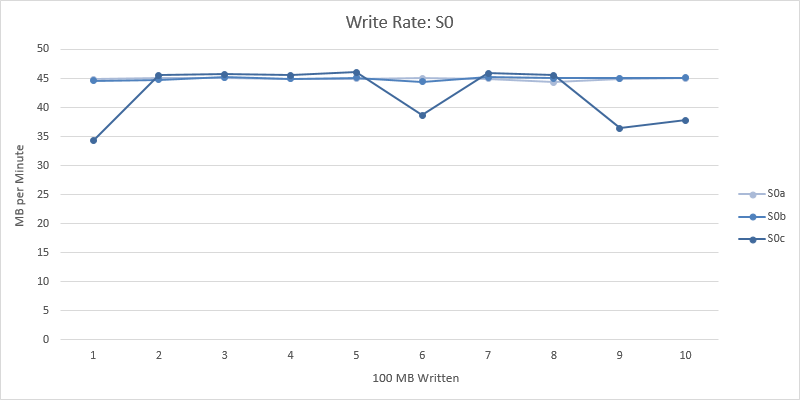
This data shows Basic, S0 and S1 writing very consistently at around 45 MB per minute throughout.  These charts are included in an appendix at the end of this post (since they all write at around 45 MB per minute, each performance level must be plotted on separate charts to avoid all the lines overlapping – which results in just too many charts to include in the main body of the text).

Comparing S1, S2, S3 and P1:

20150131_24_write

This chart shows how the write rates for S1, S2, S3 and P1 are very consistent in all tests.

This chart also shows how very consistently S2 outperforms S3.  Surely there is a bug here in Azure?

Now comparing P1 and P2:

20150131_25_write

Again, the write rate is extremely consistent for P2.

Write Test Resource Usage

During the write tests, the data from the sys.dm_db_resource_stats DMV was captured.  Unsurprisingly given the consistency shown above, this data shows the write-utilisation at very close to 100% (i.e. 98%, 99%), throughout.  As such, there is very little point plotting the data.

CPU Tests

In previous series of tests I have not compared CPU performance between the different performance levels.  As part of this series of tests, I decided running some tests to compare CPU performance between the different performance levels might be interesting.

The test is based around running the same CPU-heavy workload in each of the different performance levels and comparing the results.  The chosen workload is a forced loop join where the join condition is something non-trivial, for these tests:

(abs(((t1.Int1 * t2.Int2) + t1.Int3) - ((t2.Int1 * t1.Int2) + t2.Int4)) < 17) and (abs((power(t1.Int5 % 5, 3) - (t2.Int5 % 25))) < 7)

This query means that a relatively small number of rows will require a significant amount of time to process.  Using a relatively small number of rows is important because it eliminates any potential delays due to time waiting for the data to be read.  The test table was created with 280,000 rows of data which is in total around 10 MB.  This entire table was read before the test began properly to get the data loaded into the buffer pool.  All in all this means close to all of the query execution time is CPU time.

The query was written so that SQL Server should use a parallelised execution plan.  This allows the workload to expand to exploit the full amount of CPU resources available within the performance level.  The exact same data was used for every test.

The test script used automatically ran the test multiple times, recording the results for each test.  The number of rows selected from the test table was increased with each test (SELECT TOP … ORDER BY RowId was used to ensure data is picked up in the same way in each performance level).  The number of rows was increased until the SELECT ran for over two minutes, at which time no further tests were peformed (i.e. the row count wasn’t increased further).

The test was developed on my development machine.  This has the added advantage that the Azure results can be compared to a machine of known specification.  My development machine was built in 2010 – at the time it was a relatively high end machine.  At the core of the machine is an Intel i7 930 2.8 GHz quad core processor with hyperthreading (i.e. eight logical cores) running on an ASUS P6T Deluxe motherboard.  Details of the processor can be found here.  Details of the motherboard here.  My development machine is running an up to date copy of SQL Server 2014 so it is assumed that the engine internals involved in the test are close enough to those running in Azure SQL Database to make a comparison valid.

Results

Given the relatively large number of test cases, each with different row counts, it is easier to display these results in tabular form:

20150131_30_cpu

The table above shows three metrics, explained below.

Average query time in seconds

This shows the time taken to execute the test query in each performance level – row count combination.  For example, in the S0 column we can see that 34 seconds were required to perform the join, where the first 3000 rows were selected from the table.  The Ref column refers to my development machine (i.e. the reference machine).

In case anyone is jumping to the wrong idea… as I said above, the test query used was deliberately chosen to take a relatively long time to execute.  This query time is not indicative of the time taken to join 3000 rows in a typical business scenario!  In fact, the actual execution time is not really meaningful since the query is junk – all we care about is that it is a relatively CPU heavy workload that we can repeatedly execute in different environments and compare the execution times.

It is by comparing results between different environments that more meaningful insights can be gained.

When interpreting this table, it is important to understand what are valid/simple comparisons and what aren’t.  Comparing along the rows is valid e.g. comparing the the time to join 7500 rows on an S0 and an S1.  Joining the first 7500 rows from the test table on an S2 required 49 seconds.  Performing exactly the same join across the same test data on an S3 required 24 seconds.  Since it was the same workload, we can say S3 is twice as powerful in CPU terms as S2.

Comparing between rows in this table is not so simple.  I.e. this workload does not scale linearly.  E.g. on an S2, joining 5000 rows required 22 seconds.  Joining 10000 rows required 86 seconds.  As we are talking about a loop join here, double the rows equals four times the workload, which the results roughly agree with.

Finally, very short query times are unlikely to be good sources of information.  It is possible in much shorter queries that SQL Server may use a different execution plan.  It is also possible a larger percentage of the time may be attributable to non-CPU sources.  This is roughly those results from joining 2000 rows or less, which is why these rows have been grayed out in the table.

Performance Multiple of Reference System (Quad Core 2.8 GHz i7 930)

This metric is shown in the middle part of the table.  If we assign my development machine a metric value of 1, then comparing the query times between this system and the different Azure performance levels, we can see what fraction of my development machine CPU resources those performance levels offer.  For example, if a (CPU-heavy) query runs in ten seconds on my machine and takes twenty seconds in a particular performance level in Azure, we can say that this performance level in Azure offers half the CPU resources of my development machine.

The numbers highlighted in yellow show these results.  These show that, for example, S3 offers about one-fifth of the CPU resources of my dedicated development machine.

DTU Multiple

This metric is shown in the latter part of the table.  Taking S2 at 50 DTUs as a reference point and using the performance multiples above, it is possible to calculate the effective DTUs of each of the other performance levels.  The numbers highlighted in green show these results.

Discussion

It is interesting just how closely these results align with the number of DTUs allocated per performance level in Azure.  It is clear that the CPU resources allocated to each performance level in Azure SQL Database very closely reflect the DTU values stated by Microsoft.

By this calculation, my desktop machine offers the equivalent (in terms of CPU resources) of 500 DTUs!  I was a little surprised that even a P2 database has less than half of the CPU resources of my development machine.  Though, as I said, my development machine is still moderately high-spec (and probably way overpowered in CPU terms) and of course, my development machine does not offer any of the other great features in Azure SQL DB!

P2 Query Plans

In some of the test results, P2 appears to only offer around 150 DTUs.  These are the cells highlighted in red above.  This was actually due to Azure SQL DB using a slower query plan when executing these test cases.  For all of the other tests, the sys.dm_db_resource_stats DMV showed 100% CPU utilisation when running the tests.  For the test cases highlighted in red, CPU utilisation was reported at being only around 70%, hence the query took longer to execute.  From the 17500 row test case onwards, the faster query plan was used.  The changeover between the two plans can be seen clearly in the CPU Time results.  Normally, in a given performance level, as the row count is increased there is a significant CPU time increase too.  However, while 15000 rows required 64 seconds to execute, 17500 rows required 66 seconds, i.e. only two seconds more, as a result of the switch to the faster query plan.  These are the two timings highlighted in orange in the table above.

Memory Tests

The maximum possible memory usage under each of the performance levels can be estimated using the method described in my earlier post.  This method was used again to obtain estimates for V12:

Results

20150131_40_cpu

These results show some significant changes to the memory allocated to each performance level between v11 and v12.  S1 and S2 are able to access a significantly higher amount of memory in v12.

Interestingly S3 and P1 are allocated the same amount of memory, which mirrors the fact they both have the same DTU rating of 100.  This does mean a significant reduction in the amount of memory available under P1, however this change does make some sense.

Under v11, the memory allocated was solely determined by service tier (i.e. Basic, Standard or Premium).  All databases within a given tier had the same memory allocated, irrespective of the performance level.  Under v12, this has become more fine grained, being based on both service tier and performance level within the tier.  With this in mind, the change to P1 memory allocation can be seen to be more like a correction.  Under v11, P1 was over allocated relative to P2 (or, from the other point of view, P2 was under-allocated compared to P1).  The same applies to S0, S1, S2 and now S3.

Conclusion

Version 12 of Azure SQL Database has brought many significant performance increases over current v11.  The read rate improvements for S1 and S2 are significant.  The read rate improvements for P1 and P2 are dramatic.  The write rate improvements are also significant, especially again for the Premium Tier.  Finally this lifts P1 performance well above that of Web/Business.

The most significant questions raised by these tests are around S3.  S3 write performance is less than S2 – surely a bug/issue.  There also appears to be some volatility around the S3 read rate consistency currently, hopefully this will settle down shortly.

For customers looking to migrate from Web/Business, S3 still looks promising, however the question of the S3 write rate needs answering.  If this is not rectified, then moving from Web/Business to S3 will incur a roughly 50% cut in the write rate available.  If affordable, Premium now offers a level of resources significantly / dramatically above that available in Web/Business.

These tests have shown how the DTUs allocated to each performance level now closely reflect the resources available in each tier.  For the memory and CPU allocation there is close to a direct correlation.

Edit:  2nd Feb 2015:  Additional Test Results

I have run a couple of additional tests (following the same methodology) since the rest of this post was written that have thrown up some interesting results.  I’ll walk through them:

Massive P2 Read Rates

I conducted a further short series of P2 read tests that have shown dramatically different read rates.  I repeated the tests in the other tiers which did not show any significant increase.

  1. Repeat of P2 Read Test:  Average Read Rate = 39,200 MB per minute
  2. Repeat of P2 Read Test:  Average Read Rate = 39,800 MB per minute
    Clearly a massive increase on the earlier tests.  The read rates were sustained throughout the tests.  Several hours elapsed between the database copies being created and the tests being run (as in the earlier tests).  Buffer pool was empty at the start of the tests.  Perhaps the effect of data in a storage cache?
  3. Repeat of P1 Read Test:  Average Read Rate = 12,000 MB per minute
    i.e. matches the earlier tests described in the main body of the post.
  4. Repeat of S2 Read Test:  Average Read Rate = 580 MB per minute
    i.e. matches the earlier tests described in the main body of the post.
  5. Repeat of S0 Read Test:  Average Read Rate =  292 MB per minute
    i.e. matches the earlier tests described in the main body of the post.

Effect of NOLOCK Hint

Using the NOLOCK hint (where practical) can increase the read rate, significantly so for the premium tier:

  1. P2 Read Test:  Average Read Rate = 69,000 MB per minute
  2. P2 Read Test:  Average Read Rate = 60,900 MB per minute
    Almost double the P2 read rate result from earlier in the same day.
  3. P1 Read Test:  Average Read Rate = 13,800 MB per minute
    i.e. around 2,000 MB per minute above the earlier result.
  4. Average Read Rate = 750 MB per minute
    i.e. around a 170 MB per minute increase over the earlier result.
  5. Repeat of S0 Read Test:  Average Read Rate =  340 MB per minute
    i.e. around a 50 MB per minute over the earlier result.

Appendix: Additional Read Test Resource Usage Charts

See text above for explanation.

20150131_13_read

The Basic and S1 charts were very similar to the S0 chart, i.e. close to 100% read utilisation throughout (sorry, just too many charts to produce to create and include them all!).

20150131_14_read

20150131_16_read

Appendix: Additional Write Rate Consistency Charts

See text above for explanation.

20150131_20_write

20150131_21_write

20150131_22_write

Has Azure SQL Database Business Edition Got Slower?

Introduction

Since Microsoft released the Azure SQL Database v12 Preview in mid-December, some users have suggested there was, around the same time, a noticeable drop in the performance of the legacy Web/Business editions of Azure SQL Database.

In this post I re-run some of my earlier tests to see if that really is true.  I was planning to revisit Business Edition in any case, to get some better and more up-to-date metrics for comparison to V12 when that heads into General Availability.

July 2014 Performance

The Sequential Selects read tests performed in July 2014 estimated that Web/Business Editions read from physical disk on average at 550 MB per minute (peak 650 MB per minute).  See those earlier tests here for details.

Several write tests were also performed in July 2014.  All were reasonably consistent and estimated the maximum write rate at around 90 MB per minute.  See for example the Bulk Load tests here.

Quick Test

Before setting up any elaborate tests, I ran a quick initial read test – basically a sequential read of the whole of a 37 GB database.  This took 2 hours 50 minutes, equating to a read rate of around 225 MB per minute.  Clearly, much less than the July 2014 results and a sufficiently big enough difference to warrant further investigation.
Re-running the Sequential Select Read Tests:  Read Rate into a VM

The first full tests to run were a repeat of the July 2014 Sequential Select Tests.  This should allow a direct comparison between performance in July 2014 and January 2015.

The Sequential Select test involves reading an entire database to get a simple estimate of maximum read rates. The data is read table-by-table, and each table is read sequentially (i.e. roughly speaking SELECT * with no ORDER BY).

The test involves using a newly restored database. The database is 36 GB in size.  The test lasts 60 minutes.
The size of the database and the fact it is newly restored means that none of the data exists in the buffer pool and the test therefore estimates the maximum read rates from physical disk.

The data is read into a Windows Azure Worker Role (i.e. a VM in the same Azure data centre) which measures the data read rate and captures various other metrics.  The test uses a single reader (i.e. a single thread) which is typically sufficient to hit the read rate limit (more details on this below).

Results

20150126-01

The chart shows three different runs of the same Sequential Select test.  The read rate is quite volatile, flipping between around 200 MB per minute and around 500 MB per minute.  The first test ran almost entirely at 500 MB per minute, the second test mostly at 200 MB per minute, the third test flipped between the two rates.

Comparing with the July 2014 test results:

20150126-02

The read rate was much more stable in the July tests at around 550 MB to 600 MB per minute, though not completely stable – the third Business Edition test shows a drop to 200 MB per minute, though it is brief.

This suggests Business Edition read performance has become more volatile since July 2014.

Alternative Read Test:  Maximum Read Rate Test inside SQL Server

The older test, described above, was based on reading from the test database into a Azure Worker Role – i.e. a VM outside SQL Server.

The more recent tests I have conducted against the newer service tiers in v11 and preview v12 (see previous blog posts in December 2014) involved measuring the read rate using a simple aggregate query (i.e. select count(*) from … where … ).  This performs table scans across an entire database but the data does not leave SQL Server (only the final count(*) value is returned by the query).  Compared to the previous test, this test has the advantage that it does not involve any significant network activity between SQL Server and a VM outside of SQL Server which may have constrained the read rate in the earlier test.  This should therefore allow a better estimate of the maximum read rate from disk, free of any network constraints.  For more details of this test, see the “Test 1 – Sequential Table Scans by a SQL Query from Physical Disk into Memory” heading in the previous post here.

Results

20150126-03

Above: The data was read from the database table-by-table.  Each table was 1 GB in size.  The time taken to read each GB was measured.  The chart above shows the read-rate for each GB of data read during the test.  E.g. we can see the 24th GB in test 2 was read at a rate of around 275 MB per minute.  The test was repeated three times.

The flipping between two different read rates is even more clearly shown in this test.  The maximum read rate here is actually 800 MB per minute, higher than the 550 MB per minute seen in the earlier tests.  As suggested above, this higher rate is very likely explained by a network I/O restriction somewhere between SQL Server and the Azure Worker Role VM used in the earlier test.

However, more interesting in these results, is the fact that the flipping between the two different read rates is even clearer here.  This suggests internal logic in Business Edition that, once a given SQL Server is overloaded (i.e. when all of the different databases from all of the different users on that server attempt to read too much data too quickly), then the read rate for some/all databases on that SQL Server is limited to 200 MB per minute until the overload passes.  This is probably a simpler mechanism that provides a more reliable database service than failing databases over to other SQL Servers to attempt to balance workload (causing outages in the process).

Re-running the Scale Tests

The Scale Tests from July 2014 involved executing a mixed workload of inserts, (single and multi-row) selects, updates and deletes against copies of the same 36 GB test database.  This test was re-run as it provides a more complex workload than a simple sequential read – which is clearly not a typical workload.

Again, the test starts with a newly-restored database.  The requests are not uniformly distributed across the database (mirroring most typical OLTP workloads) so that the SQL Server Buffer Pool should have an increasing effect as the test runs and more data is cached in memory.  See the earlier post here for more details on this test.

In July 2014 tests were performed against Business Edition with different numbers of worker threads (i.e. number of concurrent requests).  The test re-run here is the heaviest of those tests – the 8T test from July 2014 – i.e. 8 worker threads running in parallel in the VM, generating requests against the test database.

Results

20150126-04

The lines on the chart show the number of operations (i.e. SQL statements) executed per second.  The blue lines are the July 2014 results.  The test was run three times in July 2014.  The green lines are the January 2015 results – again the test was run three times.

Clearly, performance is comparable between July 2014 and January 2015.  The performance is quite volatile in all six tests (as is to be expected in Business Edition where all users share/compete for server resources).

Averaging the three results from each set of tests:

20150126-05

The latter stages of the test perform better in the more recent tests.  There is no difference in the types of request generated as the test progresses.  The only thing that changes as the test progresses is that the SQL Server Buffer Pool will have more data cached (i.e. the cache starts empty and fills as requests are processed).  Therefore, this difference between July 2014 and January 2015 could be explained by an increase in the size of the SQL Server Buffer Pool per database since July 2014 allowing more data to be cached – or it could simply be a random result given the inherent volatility in Business Edition.

Write Rates

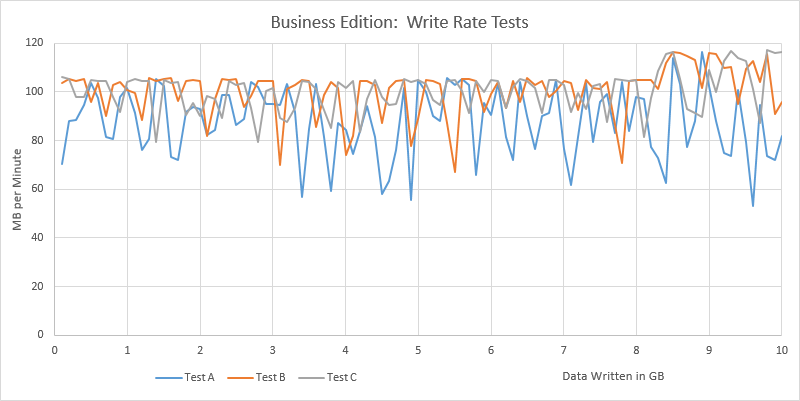
The write test conducted involved using a SQL query to write 100 MB chunks into a database, up to 10 GB in total, and measuring the write time for each chunk.  The query was executed directly on the server – i.e. no external VM and no VM to SQL Server network hops were involved.  Again, the test was executed three times.

Results

20150126-06

Above: The data was written to the database in 100 MB chunks, up to a total of 10 GB.  The time taken to write each 100 MB chunk was measured.  The chart above shows the write-rate for each chunk written during the test.  The test was repeated three times.

Clearly, the write rates are quite volatile (just as they were in July 2014).  Smoothing (via a rolling average):

20150126-07

The average write rate in the first test was around 87 MB per minute.  In the second and third tests the average rate was almost exactly 100 MB per minute on average.  Entirely consistent with the July 2014 results.

Conclusion

The Business Edition of Azure SQL Database has always featured / suffered from variable performance.  These tests appear to show the performance is more volatile in January 2015 compared to July 2014.  However there is no clear evidence for performance having been “turned down”, e.g. no lower maximum performance limit has been imposed.

The ratio of SQL servers to user databases in Azure SQL Database has likely always varied as new user databases and new batches of servers are deployed at different times.  It is probable that last July there was more spare capacity and a so a lower database density (i.e. number of databases per server) across the SQL servers in the Azure data centre.  Now, it is possible that the database density has risen and as a result performance for individual databases is being trimmed back more often to balance workloads (such as the flipping between higher and lower read rates seen in these tests).

Conspiracy theorists may suggest Microsoft have increased database density to reduce performance.  Personally I think that is unlikely.  Business Edition has always been volatile and some users have always had to endure periods of more volatile / lower performance.

Indeed, the entirety of this post shows why Business Edition is difficult to work with and will inevitably lead to difficulties for/between Microsoft and users.  Performance varies and drifts over time and there are no performance benchmarks to plan against, test against, measure against, etc.

The long term solution to this variable performance is to move into one of the newer service tiers where the performance boundaries between different databases are much more rigorously enforced.  Previously this would have incurred a much greater cost compared to the Business Edition cost.  However, the new S3 service tier in the upcoming Azure SQL Database v12 (currently in preview) should help here, providing a closer price/performance fit to Business Edition than has been available to date.  See my earlier post here for more details.

And Finally…

These tests were carried out in the Western Europe Data Centre.  It is possible performance may be different in other data centres (e.g. where the ratio of SQL Servers to user databases may be different).

Azure SQL Database: V12 Preview Performance Tests – Significant Performance Increase

Introduction

Update 31st Jan 2015:  For updated performance information describing v12 at General Availability – please see the newer post here.

Last week Microsoft announced the new V12 Preview of Azure SQL Database.  This introduces a new S3 performance level and brings to Azure a considerable number of on-premise features that have been missing to date.  These reasons alone make it a very significant update.

I have now performed some quick performance tests on V12 which have demonstrated some very substantial performance improvements.  I have also repeated some of my earlier tests against the current generally available V11 version of SQL Database to provide a direct V11 to V12 comparison.  I will summarise the tests and results below.

Important:  These results are very likely only valid today, for the particular test cases described here.  Given V12 is in preview Microsoft will almost certainly be adjusting performance levels until General Availability.  Please bear this in mind and remember any numbers here describe preview performance at the time of writing only.

Microsoft publish very few absolute performance metrics regarding Azure SQL Database.  The tests described here involve indirectly calculating absolute metrics.  Methodology is described below.

For reference, these tests were conducted against the following Azure SQL Database version (select @@version):

  • Microsoft SQL Azure (RTM) – 12.0.2000.8   Dec  8 2014 05:06:51

Read Rate Test

In my earlier posts I have described on several occasions how the read rate limits inherent in the newer service tiers (as opposed to Web/Business) will, for many databases, be a significant limiter on overall performance.  With that in mind, I am pleased that V12 appears to show very significant increases in read performance.

Test 1 – Sequential Table Scans by a SQL Query from Physical Disk into Memory

This test aimed to measure the maximum rate that data can be read from physical disk into the Buffer Pool.

The test involved using a set of test data that is likely much larger than the SQL Buffer Pool sizes:

  • Basic Edition: 2 GB database
  • Standard Edition:  20 GB database
  • Premium Edition:  30 GB database

A new database was created in each service level and populated to the sizes given above.  The database was then copied (using the Database Copy facility).  My understanding is that this performs a physical copy of the database files (determined from some other tests I have undertaken previously) and results in a new database which has an empty buffer pool i.e. no data cached in memory.  The test then involves sequentially reading through the database reading data from disk allowing the maximum physical disk read rate to be measured.

Data was divided into 1 GB tables and each table was read sequentially.

The SQL statements used to read through the database were similar to the following:

select count(*) from Table0
where [Bit1] is not null and
[TinyInt1] between 10 and 240 and
[Int3] between 100000 and 2000000000 and
[Money2] between 0 and 10000000

No indexes (other than a clustered index on the RowId primary key) were present on the tables.  A count(*) was used to ensure performance is not held back either by complex processing or by waiting for slow network I/O returning results to the client.

Results

rr1

The blue bars show performance values obtained in my earlier tests in July during the preview of the newer service tiers (Basic, Standard and Premium).  The orange bars show performance in the current generally available version (i.e. V11) of SQL Database.  V12 preview performance is shown in the green bars.  Premium P1 and P2 were also tested:

rr2

Now you can see why the Premium results needed to be split into a separate chart.

These results show a few interesting things. Firstly, the very substantial read performance increase in Premium edition.  Prem P2 was reading at 14 GB per minute in this test compared to around 800 MB per minute in the July tests.  My first impression on seeing this result was that perhaps data was somehow in the buffer pool prior to the test, thus making the result appear far too high.  However, I retrieved the query statistics from the query plan cache which reported that 30 GB of physical reads had occurred during that test, so the result appears valid.

It is also interesting to note that V11 performance has increased between the time of my July tests (when Basic, Standard and Premium were in Preview) and today.  This is partly not surprising since Microsoft state that performance will be adjusted during previews. I was however partly surprised since the changes between July and December in V11 are significant (i.e. well beyond minor adjustments).  And these changes occurred without any public announcement regarding a change in DTUs in each performance level – i.e. the stated DTUs in each performance level at the time of my July test are the same as the DTUs today (with the exception of a minor adjustment in Standard Tier to accommodate the introduction of S0).

Overall the V12 preview performance represents a big improvement over V11 and a massive improvement in the case of Prem P2.  Remember however that Microsoft may adjust the performance level between now and GA.

Side Note:  Revisiting July Tests

I reviewed my earlier tests to check if any mistake had been made in the earlier calculations though all seems correct.  For example, during my July P1 read test, the sys.resource_stats DMV was reporting 100% disk read utilisation at around 400 MB per minute.  This firmly suggests Microsoft have made some adjustments in V11 at some point between July and today (probably at GA in September), without any announced DTU change.

Test 2 – Sequential Read Rate Into an Azure Worker Role

The tests described above are a little different to the earlier tests I conducted in July.  My earlier tests measured the read rate into an Azure Worker Role i.e. into a separate machine as opposed to just reading into SQL Server Memory (as described above).

So I also repeated the earlier Sequential Select tests for comparison purposes.  These tests also demonstrated a very significant increase in performance, e.g. a P2 database could be read at 2.2 GB per minute using 8 reading threads in an A4 sized Worker Role, and a P1 database could be read at 1.5 GB per minute using 4 reading threads in an A3 sized Worker Role.

I don’t believe these tests were able to push the maximum read rate of the V12 preview.  During these tests the sys.dm_db_resource_stats was not reporting anything close to 100% in the avg_data_io_percent column (unlike in the July tests, where close to 100% was reported throughout).  This may be due to hitting a network I/O limit between the SQL Server and the Worker Role in the Azure data centre or possibly a network I/O restriction on the SQL Server.  (CPU in the worker role was not an issue – this was monitored during the tests).

Nonetheless, these tests also demonstrate a very significant performance improvement.

Read-rate metrics were captured minute-by-minute through these tests and displayed the same level of consistency as seen in the earlier tests – i.e. that the newer service tiers are much more consistent than the legacy Web/Business editions.

Comparison To Web/Business Edition

For quick comparison purposes, I have included one of the Web/Business Edition test results from my earlier tests in the charts above in this post.  It should be made clear that the Web/Business rate is for a single thread/connection – i.e. a single thread/connection could read, on average, at 550 MB per minute from Web/Business Edition in my earlier tests.  Web/Business performance was typically quite volatile throughout the earlier tests (for example see the chart here), but this was the average value reading from a Web/Business edition database into an Azure Worker role.

On the other hand, the rates for the newer Service Tiers are total limits per database.

This means when opening multiple connections to Web/Business it is sometimes possible to obtain rates much higher than 550 MB / minute.  Therefore a direct comparison is difficult, and hence this note, which hopefully makes understanding the comparison a little easier.

Reviewing the V12 Preview results I believe Microsoft are now moving towards pitching S2 and S3 as viable replacements for some of the smaller workloads in Web/Business.

I have not performed any new tests on Web/Business at this time (not enough time in the day!).

Write Rate Test

Test 1 – Large Inserts by a SQL Query from Memory

This test aimed to cache a relatively small amount of data in the buffer pool (100 MB), then repeatedly write this until a specified total data volume had been written.  Each 100 MB chunk was written using a single Insert statement.  The total data volume was specified to aim for a test very roughly around 1 hour in length  The time taken would then allow an estimate of the maximum write rate.  Total data volumes used were:

  • Basic and S0 – 1 GB.
  • S1, S2 and S3 – 2 GB.
  • P1 – 5 GB.
  • P2 – 10 GB.

Results

wr2

These tests also demonstrated significant write rate improvements compared to V11.

It is interesting to see that the standard tier performance levels appear to have slightly odd write rates in the V12 preview.  S2 actually slightly outperformed S3.  S0 and S1 were broadly similar.  I re-ran these tests twice and obtained similar results.  This is surely evidence that performance levels are still being adjusted by Microsoft and are likely to change.

For the write rates, the July 2014 results are close to the V11 December 2014 results.

Test 2 –  Bulk Load from an Azure Worker Role

Again, a second set of tests was conducted to mirror the July Bulk Load tests.  This involved using the SQL Server Bulk Load interface (via the C# SqlBulkCopy class) to write into SQL Server using multiple threads from an Azure Worker Role.

These results were comparable to those shown above.  The sys.dm_db_resource_stats showed that these tests were able to push V12 to 100% of the log rate limit.  Since even the highest I/O rate was only 250 MB per minute, there was no external limiting factor such as network bandwidth constraining the write rate from the Worker Role, so allowing it to roughly match Test 1 above.

Write-rate metrics were also captured minute-by-minute through these tests and again displayed the same level of consistency as seen in the July tests – i.e. that the newer service tiers are much more consistent than the legacy Web/Business editions.

Memory Limits

The maximum memory usage under each of the performance levels can be estimated using the method described in my earlier post.  This method was used again to try and obtain estimates for V12.

The sys.dm_db_resource_stats DMV was not reporting memory usage information for the S3, P1 and P2 performance levels.  Thus the maximum memory limit could only be estimated for the Basic, S0, S1 and S2 performance levels:

  • Basic – 256 MB = no change from current V11 value
  • Std S0 – 512 MB = no change from current V11 value
  • Std S1 – 1024 MB = compared to 512 MB currently in V11
  • Std S2 – 2560 MB = compared to 512 MB currently in V11

Clearly, these are steps in the right direction and may make S1 and in particular S2 perform much better for some workloads than has previously been the case under V11.

Conclusion

This post has been a very quick run through some performance tests against the new V12 Preview.  Pleasingly, I/O performance, especially read-performance, seems significantly better in V12.

It will be interesting to see where the S3 I/O performance level settles at GA, since S3 may well be the cost-effective option for many existing Web/Business users for whom Premium P1 is simply too expensive (to the point of otherwise potentially leaving Azure altogether for these workloads).  That Microsoft have already said S3 will run at 100 DTUs is a good sign that it will land in this area.

The Premium Service Tier has, in the past, been viewed as very expensive for the level of performance that it delivers.  If the performance at V12 GA lands as it is currently running in Preview, then Microsoft will have made a clear step forward in addressing that criticism.

Latest Azure SQL Database Changes: V12 Preview

Update (18th Dec):  For performance test results, including comparing v11 with v12 Preview, please see the following post.

This is a very brief post since I am currently busy with other things and haven’t had time to test the Azure SQL Database V12 Preview yet.  In short, V12 brings a whole heap of missing “on-prem” edition features to Azure and introduces a new performance level, S3.  All great things.  I am however a little bit confused about the story of the S3 performance level.  I’ve posted a comment on Scott Gu’s blog post:

I am happy to read about the improvements to Azure SQL DB. Excellent news that the on-prem/IAAS vs. PAAS feature gap is closing in a big way. I do have a couple of questions though:
We now seem to have both S3 and P1 at 100 DTUs, but with very different prices, which seems odd. Even though P1 offers numerous other/improved features over Standard Tier, the price difference seems very large given the “DTU” equality.
Further, it is stated that P2 and P3 are getting I/O improvements, but there is no mention of changes to the DTUs to these tiers. If actual performance (i.e. IOPs) is changing, then presumably DTUs should be increased (unless the definition of a DTU itself is changing). I am a bit confused. The story here seems incomplete. Can you help clarify things?

It almost seems as though there might (pure speculation) be some other as-yet unannounced changes to the other existing Standard/Premium service tier performance levels coming to straighten this out (perhaps at the V12 GA?).  Maybe, then again maybe not – the whole DTU story has always been a little bit confusing to me!

Hopefully I’ll get some time to take V12 for a test drive over the next couple of weeks.

Azure SQL Database Memory Limits By Service Tier

Background

The new service tiers in Azure SQL Database provide different levels of performance, by offering more of the following at each higher service level:

  • Processing (CPU) Time
  • Read Rate (from physical disk)
  • Write Rate (to the database log file).
  • Memory (space to cache and process data)

One of the frustrating aspects of the new service tiers on a technical level is that Microsoft are not providing any particularly meaningful performance units to measure the new tiers by.  Everywhere you look you find relative units, be it DTUs or be it percentages that measure resource utilisation in each tier or compare between tiers (e.g. in the sys.resource_stats / sys.dm_db_resource_stats DMVs in the master / your database respectively).

My earlier performance tests provided some information about the maximum read and write rates supported by each tier.

I’ve now performed some further tests that provide some information about the memory limits in each tier / performance level.  Results are given first.  The methodology is at the end of this post.

Test Results – Azure SQL DB Memory Allocation

The tests suggest each database is allocated memory as follows:

  • Web / Business Edition – at least 5 GB (likely variable).
  • Basic Tier – 250 MB
  • Standard Tier S0 – 512 MB
  • Standard Tier S1 – 512 MB
  • Standard Tier S2 – 512 MB
  • Premium Tier P1 – 9 GB
  • Premium Tier P2 – 9 GB

Premium P3 was not tested.  It is not possible to obtain exact figures for Web/Business edition since the DMVs don’t contain memory information in that edition.  However, repeating the same tests has proven that it is possible in Web/Business edition to cache at least 5 GB in memory. More on this below.

This test also allowed some write-rate metrics to be captured.  These are more or less identical to those captured during the earlier tests, i.e. nothing has changed here.

Thoughts

Continue reading

Free Tool: SQL Workload Profiler: For On-Premise and Azure SQL DB

Over the past few weeks I have enhanced a tool I previously developed for gathering and analysing SQL Server Performance Statistics.

Today I have made the tool available via this blog.  It is called SQL Workload Profiler:

20140928_01_Delta      20140928_03_Chart

The tool aims to to provide performance statistics for the queries running in your SQL Server minute-by-minute (or less), together with a quick and simple analysis interface to allow that data to be explored.  The captured granular statistics can also be written to a SQL Table during data collection for saving, more detailed analysis, etc.

Many more details can be found over on the SQL Workload Profiler page.