Introduction
Update 31st Jan 2015: For updated performance information describing v12 at General Availability – please see the newer post here.
Last week Microsoft announced the new V12 Preview of Azure SQL Database. This introduces a new S3 performance level and brings to Azure a considerable number of on-premise features that have been missing to date. These reasons alone make it a very significant update.
I have now performed some quick performance tests on V12 which have demonstrated some very substantial performance improvements. I have also repeated some of my earlier tests against the current generally available V11 version of SQL Database to provide a direct V11 to V12 comparison. I will summarise the tests and results below.
Important: These results are very likely only valid today, for the particular test cases described here. Given V12 is in preview Microsoft will almost certainly be adjusting performance levels until General Availability. Please bear this in mind and remember any numbers here describe preview performance at the time of writing only.
Microsoft publish very few absolute performance metrics regarding Azure SQL Database. The tests described here involve indirectly calculating absolute metrics. Methodology is described below.
For reference, these tests were conducted against the following Azure SQL Database version (select @@version):
- Microsoft SQL Azure (RTM) – 12.0.2000.8 Dec 8 2014 05:06:51
Read Rate Test
In my earlier posts I have described on several occasions how the read rate limits inherent in the newer service tiers (as opposed to Web/Business) will, for many databases, be a significant limiter on overall performance. With that in mind, I am pleased that V12 appears to show very significant increases in read performance.
Test 1 – Sequential Table Scans by a SQL Query from Physical Disk into Memory
This test aimed to measure the maximum rate that data can be read from physical disk into the Buffer Pool.
The test involved using a set of test data that is likely much larger than the SQL Buffer Pool sizes:
- Basic Edition: 2 GB database
- Standard Edition: 20 GB database
- Premium Edition: 30 GB database
A new database was created in each service level and populated to the sizes given above. The database was then copied (using the Database Copy facility). My understanding is that this performs a physical copy of the database files (determined from some other tests I have undertaken previously) and results in a new database which has an empty buffer pool i.e. no data cached in memory. The test then involves sequentially reading through the database reading data from disk allowing the maximum physical disk read rate to be measured.
Data was divided into 1 GB tables and each table was read sequentially.
The SQL statements used to read through the database were similar to the following:
select count(*) from Table0
where [Bit1] is not null and
[TinyInt1] between 10 and 240 and
[Int3] between 100000 and 2000000000 and
[Money2] between 0 and 10000000
No indexes (other than a clustered index on the RowId primary key) were present on the tables. A count(*) was used to ensure performance is not held back either by complex processing or by waiting for slow network I/O returning results to the client.
Results
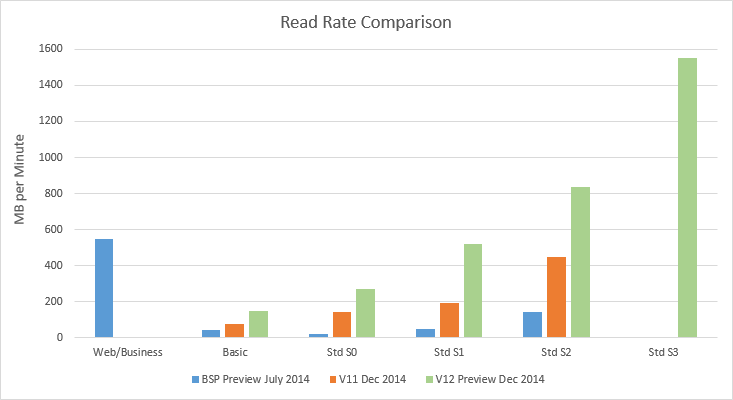
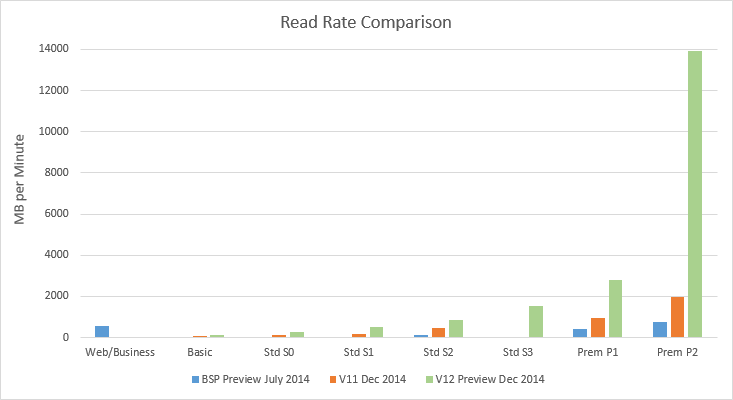
The blue bars show performance values obtained in my earlier tests in July during the preview of the newer service tiers (Basic, Standard and Premium). The orange bars show performance in the current generally available version (i.e. V11) of SQL Database. V12 preview performance is shown in the green bars. Premium P1 and P2 were also tested:
Now you can see why the Premium results needed to be split into a separate chart.
These results show a few interesting things. Firstly, the very substantial read performance increase in Premium edition. Prem P2 was reading at 14 GB per minute in this test compared to around 800 MB per minute in the July tests. My first impression on seeing this result was that perhaps data was somehow in the buffer pool prior to the test, thus making the result appear far too high. However, I retrieved the query statistics from the query plan cache which reported that 30 GB of physical reads had occurred during that test, so the result appears valid.
It is also interesting to note that V11 performance has increased between the time of my July tests (when Basic, Standard and Premium were in Preview) and today. This is partly not surprising since Microsoft state that performance will be adjusted during previews. I was however partly surprised since the changes between July and December in V11 are significant (i.e. well beyond minor adjustments). And these changes occurred without any public announcement regarding a change in DTUs in each performance level – i.e. the stated DTUs in each performance level at the time of my July test are the same as the DTUs today (with the exception of a minor adjustment in Standard Tier to accommodate the introduction of S0).
Overall the V12 preview performance represents a big improvement over V11 and a massive improvement in the case of Prem P2. Remember however that Microsoft may adjust the performance level between now and GA.
Side Note: Revisiting July Tests
I reviewed my earlier tests to check if any mistake had been made in the earlier calculations though all seems correct. For example, during my July P1 read test, the sys.resource_stats DMV was reporting 100% disk read utilisation at around 400 MB per minute. This firmly suggests Microsoft have made some adjustments in V11 at some point between July and today (probably at GA in September), without any announced DTU change.
Test 2 – Sequential Read Rate Into an Azure Worker Role
The tests described above are a little different to the earlier tests I conducted in July. My earlier tests measured the read rate into an Azure Worker Role i.e. into a separate machine as opposed to just reading into SQL Server Memory (as described above).
So I also repeated the earlier Sequential Select tests for comparison purposes. These tests also demonstrated a very significant increase in performance, e.g. a P2 database could be read at 2.2 GB per minute using 8 reading threads in an A4 sized Worker Role, and a P1 database could be read at 1.5 GB per minute using 4 reading threads in an A3 sized Worker Role.
I don’t believe these tests were able to push the maximum read rate of the V12 preview. During these tests the sys.dm_db_resource_stats was not reporting anything close to 100% in the avg_data_io_percent column (unlike in the July tests, where close to 100% was reported throughout). This may be due to hitting a network I/O limit between the SQL Server and the Worker Role in the Azure data centre or possibly a network I/O restriction on the SQL Server. (CPU in the worker role was not an issue – this was monitored during the tests).
Nonetheless, these tests also demonstrate a very significant performance improvement.
Read-rate metrics were captured minute-by-minute through these tests and displayed the same level of consistency as seen in the earlier tests – i.e. that the newer service tiers are much more consistent than the legacy Web/Business editions.
Comparison To Web/Business Edition
For quick comparison purposes, I have included one of the Web/Business Edition test results from my earlier tests in the charts above in this post. It should be made clear that the Web/Business rate is for a single thread/connection – i.e. a single thread/connection could read, on average, at 550 MB per minute from Web/Business Edition in my earlier tests. Web/Business performance was typically quite volatile throughout the earlier tests (for example see the chart here), but this was the average value reading from a Web/Business edition database into an Azure Worker role.
On the other hand, the rates for the newer Service Tiers are total limits per database.
This means when opening multiple connections to Web/Business it is sometimes possible to obtain rates much higher than 550 MB / minute. Therefore a direct comparison is difficult, and hence this note, which hopefully makes understanding the comparison a little easier.
Reviewing the V12 Preview results I believe Microsoft are now moving towards pitching S2 and S3 as viable replacements for some of the smaller workloads in Web/Business.
I have not performed any new tests on Web/Business at this time (not enough time in the day!).
Write Rate Test
Test 1 – Large Inserts by a SQL Query from Memory
This test aimed to cache a relatively small amount of data in the buffer pool (100 MB), then repeatedly write this until a specified total data volume had been written. Each 100 MB chunk was written using a single Insert statement. The total data volume was specified to aim for a test very roughly around 1 hour in length The time taken would then allow an estimate of the maximum write rate. Total data volumes used were:
- Basic and S0 – 1 GB.
- S1, S2 and S3 – 2 GB.
- P1 – 5 GB.
- P2 – 10 GB.
Results
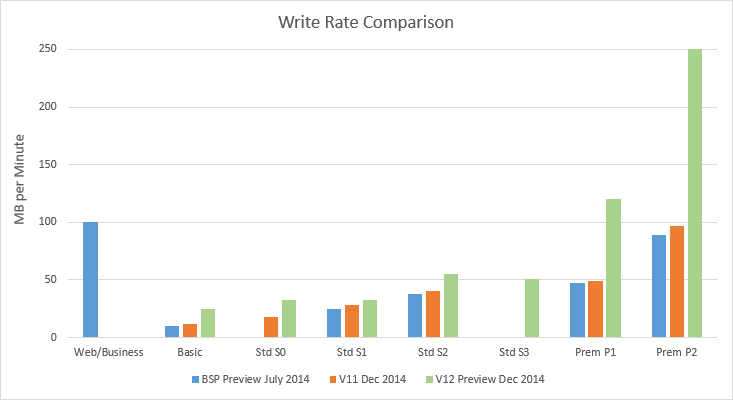
These tests also demonstrated significant write rate improvements compared to V11.
It is interesting to see that the standard tier performance levels appear to have slightly odd write rates in the V12 preview. S2 actually slightly outperformed S3. S0 and S1 were broadly similar. I re-ran these tests twice and obtained similar results. This is surely evidence that performance levels are still being adjusted by Microsoft and are likely to change.
For the write rates, the July 2014 results are close to the V11 December 2014 results.
Test 2 – Bulk Load from an Azure Worker Role
Again, a second set of tests was conducted to mirror the July Bulk Load tests. This involved using the SQL Server Bulk Load interface (via the C# SqlBulkCopy class) to write into SQL Server using multiple threads from an Azure Worker Role.
These results were comparable to those shown above. The sys.dm_db_resource_stats showed that these tests were able to push V12 to 100% of the log rate limit. Since even the highest I/O rate was only 250 MB per minute, there was no external limiting factor such as network bandwidth constraining the write rate from the Worker Role, so allowing it to roughly match Test 1 above.
Write-rate metrics were also captured minute-by-minute through these tests and again displayed the same level of consistency as seen in the July tests – i.e. that the newer service tiers are much more consistent than the legacy Web/Business editions.
Memory Limits
The maximum memory usage under each of the performance levels can be estimated using the method described in my earlier post. This method was used again to try and obtain estimates for V12.
The sys.dm_db_resource_stats DMV was not reporting memory usage information for the S3, P1 and P2 performance levels. Thus the maximum memory limit could only be estimated for the Basic, S0, S1 and S2 performance levels:
- Basic – 256 MB = no change from current V11 value
- Std S0 – 512 MB = no change from current V11 value
- Std S1 – 1024 MB = compared to 512 MB currently in V11
- Std S2 – 2560 MB = compared to 512 MB currently in V11
Clearly, these are steps in the right direction and may make S1 and in particular S2 perform much better for some workloads than has previously been the case under V11.
Conclusion
This post has been a very quick run through some performance tests against the new V12 Preview. Pleasingly, I/O performance, especially read-performance, seems significantly better in V12.
It will be interesting to see where the S3 I/O performance level settles at GA, since S3 may well be the cost-effective option for many existing Web/Business users for whom Premium P1 is simply too expensive (to the point of otherwise potentially leaving Azure altogether for these workloads). That Microsoft have already said S3 will run at 100 DTUs is a good sign that it will land in this area.
The Premium Service Tier has, in the past, been viewed as very expensive for the level of performance that it delivers. If the performance at V12 GA lands as it is currently running in Preview, then Microsoft will have made a clear step forward in addressing that criticism.


